Drawing objects
In WYSIWYG, the menu lists the objects that you can draw. Keep the following tips
and aids in mind when you are drawing the various objects.
Drawing tips
- Command Line: At
any time, instead of clicking points with the mouse, you can type
in the desired coordinates. When you start typing, the Command
Line automatically appears in the lower left-hand corner of
the window.
- Shortcuts: Create
shortcuts for library objects.
- Missing Coordinate:
Use the missing coordinate.
- Multi-segmented lines:
When you draw multi-segmented lines, surfaces, or when drawing a room
using the Room Builder, the next point of the line or surface you
wish to add snaps automatically to the previously drawn line/surface's
endpoint, midpoint or intersection when the Endpoint
Snap, Midpoint Snap and/or Intersection Snap are enabled.
- Insertion Points:
Before you place a 2D/3D primitive object, screen, or LED wall, you
can right-click on the object and select its from the menu that appears. See Insertion
points for details.
Drawing aids
Several commands and icons are available
to help you when drawing in CAD mode. For a complete list of these aids,
refer to Keyboard shortcuts and hotkeys.
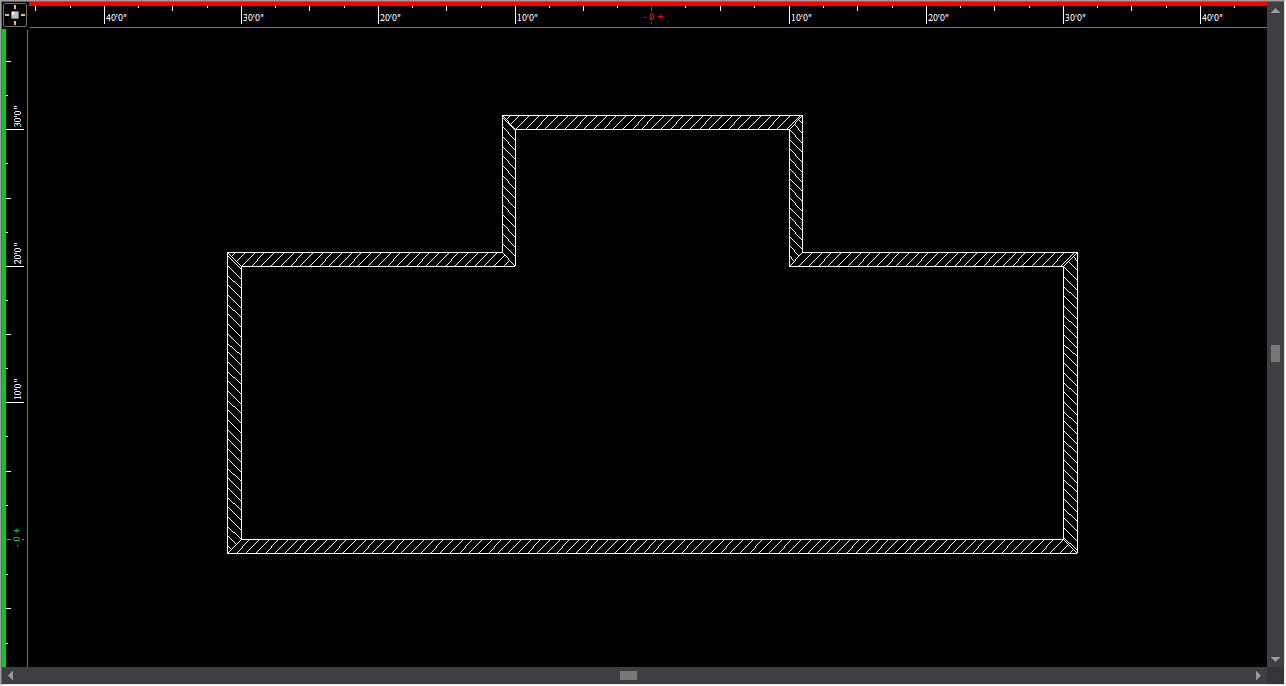
Drawing a custom room
The Room Builder
tool allows you to build a custom room of any shape in Wireframe view.
To draw a custom room
- From the menu,
choose .
Result: A
cross-hair appears on your cursor in the drawing wireframe.
- Click to place a corner of the wall at the location
of the cursor. Each subsequent click will connect the current corner
to the previous corner.
- To finish the room drawing, connected the first
and last created corner.
Notes:
- Alternately, the room can be closed, connected
the first and last created corner automatically, by right-clicking
and selecting .
- To finish a room without closing it, right-click
and select
Result: The
Room Builder window appears.
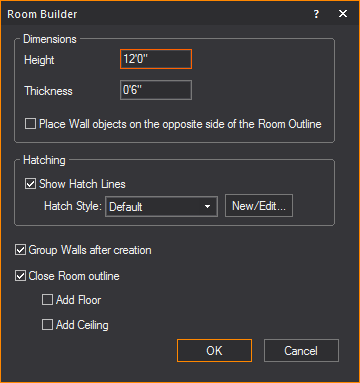
- In the Room Builder window,
enter in the missing characteristics of the room walls.
- Select the Place Wall
objects on the opposite side of the Room Outline checkbox
if you want to place object on the opposite side of the Room Outline.
- Select the Group Walls
after creation checkbox if you want all created walls to be
in the same group.
- Select the Close Room
outline checkbox if you want to add floors or ceilings to the
room.
Note: This
option is only available if the room is closed. When a room is closed,
WYSIWYG automatically makes the Walls transparent from outside of the
room looking inwards, and makes the ceiling and floor single sided, so
when the camera is outside of the room the user can see inside. These
properties can be changed if the user wishes, by going to the objects'
properties
- Select the Add Floor
checkbox to add a floor to the room
- Select the Add Ceiling
checkbox to add a ceiling to the room.
- Click Ok.
Result: The
custom room is created in Wireframe view.
Drawing
a venue
To begin your drawing, insert a venue.
To insert a venue
- From the menu,
choose .
Result: A
sub-menu appears prompting you to choose the type of venue to be inserted.
- Select ,
, .
Result: A
dialog box appears in which you can modify the properties of the room.
The Proscenium Arch dialog box is shown
below.
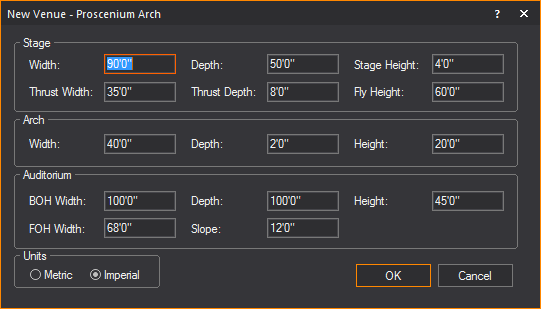
- Accept the defaults, or choose custom properties.
- Click OK.
Result: The
selected venue is inserted into the drawing.
The venue types are defined as follows:
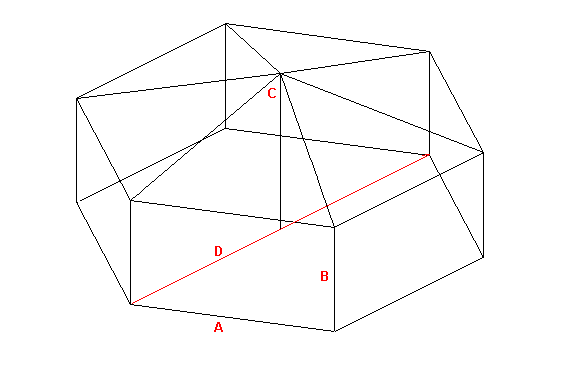
Proscenium Arch
A Proscenium Arch venue is a basic theatrical
space with a stage, proscenium arch, and an auditorium. The origin is
set at the intersection of the center line and the proscenium line on
the stage floor.
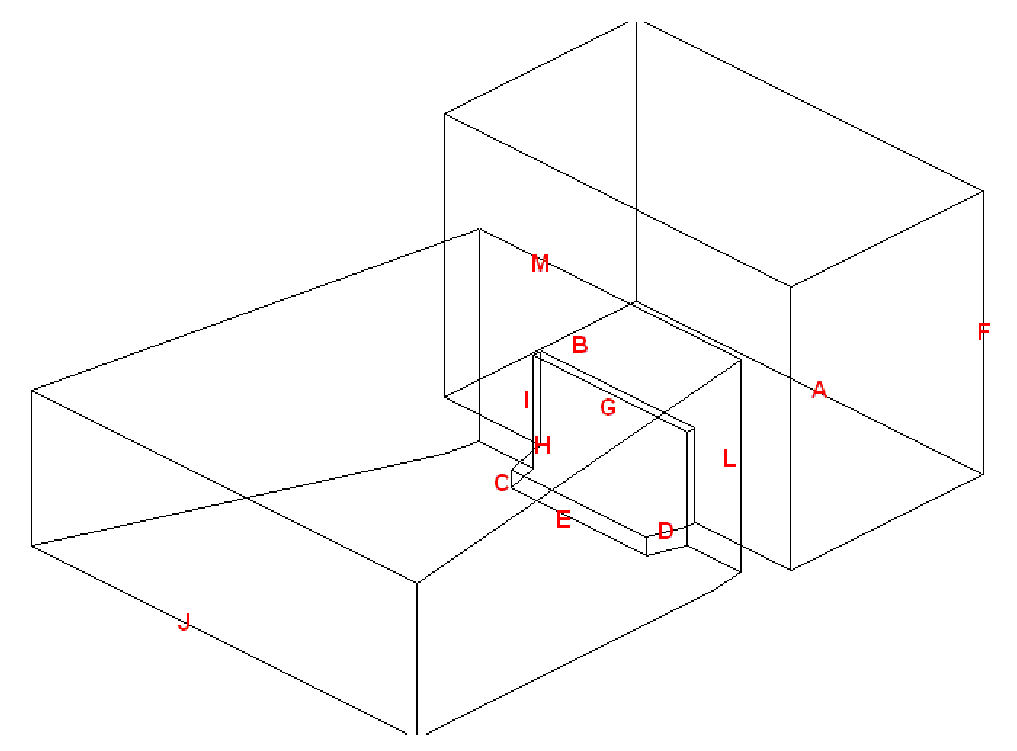
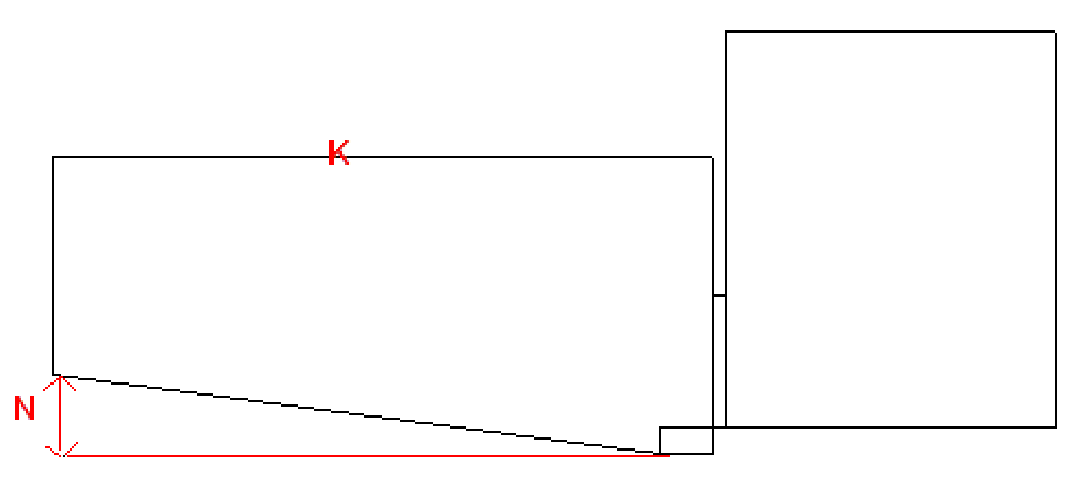
The following entries describe the parts
of the proscenium arch.
- A: The stage width; the dimension from the extremity
of the SR wing to the extremity of the SL wing. In WYSIWYG, the default
value is 90’0”.
- B: The stage depth; the dimension from the proscenium
line to the back of the stage space. In WYSIWYG, the default value
is 50’0”.
- C: The stage height; the dimension from the auditorium
floor to the stage deck. In WYSIWYG, the default value is 4’0”.
- D: The thrust depth; the dimension from the edge
of the stage to the proscenium line. In WYSIWYG, the default value
is 8’0”.
- E: The thrust width; the dimension from the extremity
of the SR edge of the thrust to the SL extremity of the thrust. This
dimension cannot be greater than the Arch width (G). In WYSIWYG, the
default value is 35’0”.
- F: The Fly height; the dimension from the stage
deck to the top of the fly house. In WYSIWYG, the default value is
60’0”.
- G: The proscenium arch width. In WYSIWYG, the
default value is 40’0”.
- H: The depth of the proscenium arch wall. In WYSIWYG,
the default value is 2’0”.
- I: The height of the proscenium arch; the dimension
of the opening of the proscenium arch. In WYSIWYG, the default value
is 20’0”.
- J: The back of house (BOH) width; the dimension
of the auditorium from the extremity of house right to the extremity
of house left at the back of the house. In WYSIWYG, the default value
is 100’0”.
- K: The auditorium depth; the dimension from the
proscenium line to the back of the house. In WYSIWYG, the default
value is 100’0”.
- L: The auditorium height; the dimension from the
ceiling of the auditorium to the floor of the auditorium at the edge
of the stage. In WYSIWYG, the default value is 45’0”.
- M: The front of house (FOH) width; the dimension
of the auditorium from the extremity of house right to the extremity
of house left at the front of the house. In WYSIWYG, the default value
is 68’0”.
- N: The auditorium slope height. In WYSIWYG, the
default value is 12’0”.
Black Box
A Black Box venue is an empty rectangular
room. The origin is set at the center of the room on the floor.
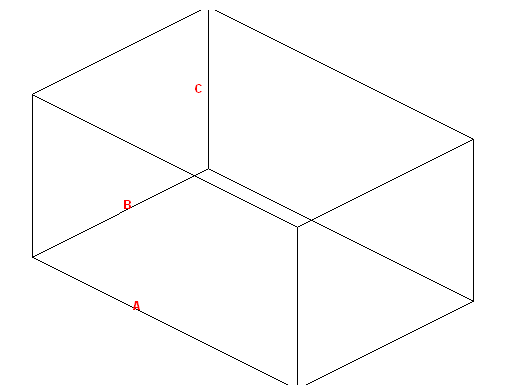
The following entries describe the parts
of the black box:
- A: The width of the room. In WYSIWYG, the default
value is 60’0”.
- B: The depth of the room. In WYSIWYG, the default
value is 40’0”.
- C: The height of the room. In WYSIWYG, the default
value is 30’0”.
Arena
An Arena venue is a basic stadium space.
The following entries describe the parts of the arena. The origin is set
at the center of the venue on the floor or ice rink.
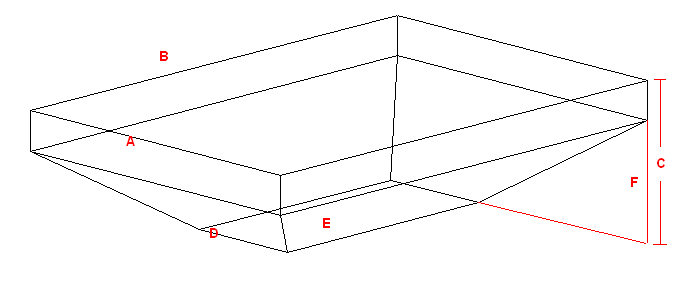
- A: The width of the arena. In WYSIWYG, the default
value is 170’0”.
- B: The depth of the arena. In WYSIWYG, the default
value is 250’0”.
- C: The total height of the arena. In WYSIWYG,
the default value is 60’0”.
- D: The width of the floor or ice rink. In WYSIWYG,
the default value is 60’0”.
- E: The depth of the floor or ice rink. In WYSIWYG,
the default value is 130’0”.
- F: The height of the stands or seating; the portion
of the total height that is occupied by seating or stands. In WYSIWYG,
the default value is 40’0”.
Tent
There are two types of tents that you can
create in WYSIWYG: Frame Tents and Circus Tents.
- Frame Tents:
These tents are square or rectangular in shape and usually have two
center poles. Each wall is made of a single piece of fabric supported
by as many poles as you specify.
- Circus Tents:
These tents are styled after the classical “Big Top” of the circus.
They are more rounded in shape than the frame tent, the walls comprising
multiple sections, each supported by as many poles as you specify.
The roof is held up by one center pole.
When drawing either type of tent, you can
specify many different properties, including the number of poles, length,
height, or perimeter of the walls, and the color of different parts of
the tent.
You can also choose from different materials
and you can choose whether you want to apply either a custom color or
texture to different parts of the tent. When assigning a texture, you
can choose your own texture, such as a company logo or symbol, or you
can choose a texture from the WYSIWYG library.
The origin for both types of tents is at
the center of the tent on the floor.
Frame Tent
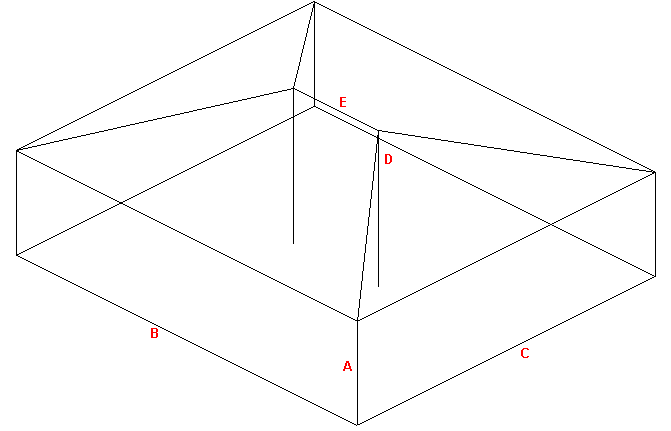
The following entries describe the parts
of the frame tent:
|
Description |
New
Venue - Tent Field |
WYSIWYG
Default Value |
A |
The height of the tent walls. |
Wall height |
20’0” |
B |
The length of the tent walls. |
Width |
80’0” |
C |
The width the tent walls. |
Depth |
70’0” |
D |
The height that the center pole extends above
the height of the walls. |
Height above walls |
10’0” |
E |
The
distance between the center poles. |
Separation |
20’0” |
Circus Tent
The following entries describe the parts
of the circus tent:
|
Description |
New
Venue - Tent Field |
WYSIWYG
Default Value |
A |
The number of individual segments in the
tent. |
Segments |
6 |
B |
The height of the tent walls. |
Wall height |
20’0” |
C |
The height that the center pole extends above
the height of the walls. |
Height above walls |
10’0” |
D |
The
diameter of the tent, measured from pole to opposite pole. |
Diameter |
70’0” |
Drawing lines
Lines are 2D objects. Lines are drawn continuously,
allowing you to create shapes made up of multiple vertices.
Line Patterns
Lines come in four pattern styles.
Line patterns determine how line objects
appear on your plot and can be modified at any time. The image below shows
how line patterns appear in WYSIWYG.
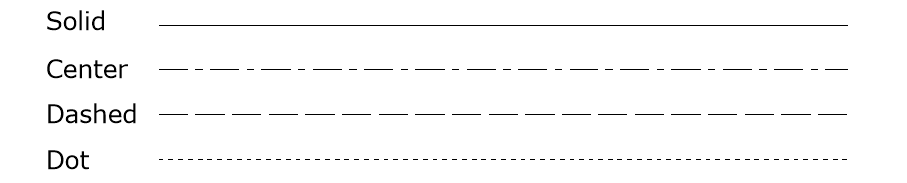
Line patterns are available to a Rectangle,
Circle, Ellipse, Arc or Elliptical Arc, and a Closed Line Polygon.
Spline
You can make a multi-vertex line appear
as a spline or french curve by selecting the option in the properties
box. You can then drag the markers around to adjust the curves. Alternatively,
you can choose to draw a spline directly. Splines have the same line style
options as regular lines.
Multi-segmented lines
When you draw multi-segmented lines, or
add a line to a surface, the next point of the line you wish to add snaps
automatically to the previously drawn line/surface’s endpoint, midpoint
or intersection when the Endpoint Snap,
Midpoint Snap or Intersection
Snap are enabled.
Lines can be extruded into surfaces. For
information on extruding lines, see Extrude.
To draw a line freehand
- From the menu,
choose .
- From the sub-menu, select ,
, ,
or .
Tip: You can
also use the appropriate line tool on the Draw toolbar.
The available line tools are as follows:
-
 Solid
Solid
 Centered
 Dashed
 Dotted
 Spline
- Click in the wireframe at the starting point of
the line.
- Drag the next vertex to its end point and click.
- Continue to place vertices of the line as needed.
- To end the line at its last end point, right-click
and choose . To abort the
line entirely, choose . This
erases the whole line from the drawing.
To draw a line by specifying coordinates
You can also draw lines using coordinates
by specifying absolute or relative values.
- From the menu,
choose and select ,
, or
.
- In the Command Line,
type the absolute X, Y and Z coordinates (separated by commas) where
you want the line to start (i.e. 0,0,0).
- Press ENTER
to establish the first point of the line.
- In the Command Line,
type the absolute X, Y and Z coordinates (separated by commas) where
you want the next point of the line.
or
Using the relative values, in the Command Line, type @,
followed by the length towards the next point of the line (positive or
negative direction), (i.e. @2’,0,3’).
- Press ENTER
to draw the new line segment.
- Continue to type absolute or relative values and
press ENTER to draw the next
line segments.
- When you are finished drawing the lines, right-click
and click .
To draw a line by specifying its length and angle
- From the menu,
choose and select ,
, or
.
- In the Command Line,
type the X, Y and Z coordinates (separated by commas) where you want
the line to start.
- Press ENTER
to establish the first point of the line.
- Type the length towards the next point of the
line, followed by the < sign,
and the angle (direction), (i.e.3’6”<180).
- Press ENTER
to draw the new line segment.
- Continue to type the length and angle in the Command Line.
- When you are finished drawing the lines, right-click
and click .
Tip: You can
also determine the direction of the line from the cursor’s current position
relative to the start point set in step 2.
Drawing
points
Points are identifiers of a specific coordinate
in 3D space. Points are inserted as references or as scenic elements.
To draw a point
- From the menu,
choose .
Tip: You can
also use the Point tool on the Draw toolbar.
 The
Point button.
The
Point button.
- Click on the drawing to place the point.
Note: Points
can be drawn as a dot, a cross, a square, or a circle.
To set the point type default
- From the menu,
choose .
- Click the Object Settings
tab.
- Select the desired point type.
- Click OK.
Drawing circles
There are two ways in which you can draw
circles:
- Non-interactive mode in which you type the exact
horizontal and vertical radius of the circle.
- Interactive mode in which you click and drag to
set the radius.
To draw a circle
in non-interactive mode
- From the menu,
choose .
Tip: You can
also use the Circle tool on the Draw toolbar.
 The Circle
button.
The Circle
button.
Result: The
New Circle dialog box appears.
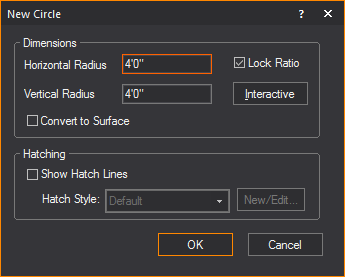
- In the Horizontal Radius box, type the horizontal radius
for the circle. The default value is 4’0”.
- In the Vertical Radius box, type the vertical radius
for the circle. The default value is 4’0”.
Notes:
- To ensure that the circle remains proportionately
the same when resized, leave the Lock Ratio checkbox
checked. If you clear this checkbox, then you can manually resize
the circle in any direction, regardless of its original measurements.
- To convert the circle into a surface, select
the Convert to Surface checkbox.
- Click OK.
- Click on the drawing to place the circle.
- Click elsewhere in the drawing to finish placing
the new circle.
To draw a circle in interactive mode
Note: To turn
interactive mode on, click the Interactive Mode
button on the toolbar.
 The Interactive Mode button.
- From the menu,
choose .
Tip: You can
also use the Circle tool on the Draw toolbar.
 The Circle
button.
The Circle
button.
- Click to place the center of the circle.
- Click to set the radius for the circle.
Drawing arcs
There are two ways in which you can draw
arcs:
- Non-interactive mode in which you type the exact
radius, start, and end angles of the arc.
- Interactive mode in which you click and drag to
set the arc.
To draw an arc in non-interactive mode
- From the menu,
choose
Tip: You can
also use the Arc tool on the Draw toolbar.
 The Arc
button.
The Arc
button.
Result: The
New Circular Arc window appears.
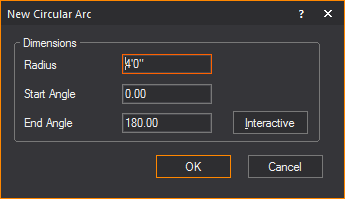
- In the Radius box,
type a radius for the arc. The default value is 4’0”.
- In the Start Angle
box, type the start angle. The default value is 0.00.
- In the End Angle box,
type the end angle for the arc. The default value is 180.00.
- Click OK.
- Click on the drawing to place the arc.
To draw an arc
in interactive mode
Note: To turn
interactive mode on, click the Interactive Mode button
on the toolbar.
 The Interactive Mode button.
- From the menu,
choose .
Tip: You can
also use the Arc tool on the Draw toolbar.
 The Arc
button.
The Arc
button.
- Click to place the start point of the arc.
- Click to place the end point of the arc.
- Click to place the middle point of the arc.
- Click elsewhere in the drawing to finish placing
the arc.
Drawing
elliptical arcs
There are two ways to draw an arc:
- Non-interactive mode in which you specify the
elliptical arc radius, start and end angles and place the arc in the
drawing.
- Interactive mode in which you draw the elliptical
arc.
To draw an elliptical arc in non-interactive mode
- From the menu,
choose .
Tip: You can
also use the Elliptical Arc tool on
the Draw toolbar.
 The Elliptical
Arc button.
The Elliptical
Arc button.
Result: The
New Elliptical Arc window appears.
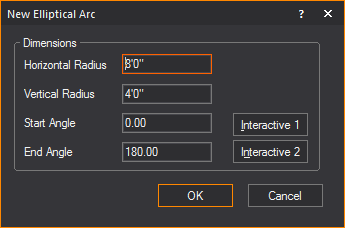
- In the Radius box,
enter a radius for the elliptical arc. The default value is 4’0”.
- In the Start Angle box,
enter the start elliptical angle. The default value is 0.00.
- In the End Angle box,
enter the end angle for the elliptical arc. The default value is 180.00.
- Click OK.
- Click and drag the mid point of the arc to create
the desired elliptical.
To draw an arc in interactive mode
Note: To turn interactive
mode on, click the Interactive Mode button
on the toolbar.
 The Interactive
Mode button.
The Interactive
Mode button.
- From the menu,
choose .
Tip: You can
also use the Arc Elliptical tool on
the Draw toolbar.
 The Elliptical
Arc button.
The Elliptical
Arc button.
- Click to place the start point of the elliptical
arc.
- Click to set the horizontal and vertical radii
of the elliptical arc.
- Click to set the start point of the ellipse.
- Click to set the end point of the ellipse.
Drawing rectangles
There are two ways to draw rectangles:
- Non-interactive mode in which you enter the exact
length and width of the rectangle.
- Interactive mode in which you draw the size of
the rectangle.
To draw a rectangle in non-interactive mode
- From the menu,
choose .
Tip: You can
also use the Rectangle tool on the
Draw toolbar.
 The Rectangle
button.
The Rectangle
button.
Result: The
New Rectangle window appears.
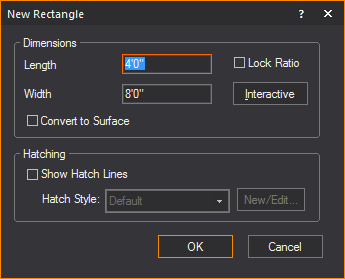
- In the Length box,
type the length for the rectangle. The default value is 4’0”.
- In the Width box,
type the width for the rectangle. The default value is 8’0”.
Tips:
- To ensure that the rectangle remains proportionately
the same when resized, select the Lock Ratio checkbox.
Otherwise you can manually resize the rectangle in any direction,
regardless of its original measurements.
- To convert the rectangle into a surface, select
the Convert to Surface checkbox.
- To add hatching to the rectangle, select the
Show Hatch Lines checkbox.
- Click OK.
- Click in the drawing to place the rectangle.
To draw a rectangle in interactive mode
Note: To turn
interactive mode on, click the Interactive Mode button
on the toolbar.
 The Interactive Mode button.
- From the menu,
choose .
Tip: You can
also use the Rectangle tool on the
Draw toolbar.
 The Rectangle
button.
The Rectangle
button.
- Click to place one corner of the rectangle.
- Click to place the opposite corner for the rectangle.
Drawing
polygons
Polygons are regular shaped objects comprising
multiple vertices. You can draw polygons as 2D objects or specify a height
value to draw 3D objects. You can use polygons to create either wireframe
or solid objects.
Unlike the Surface tool, with the Polygon
tool you can quickly and easily create symmetrical shapes like squares,
pentagons, hexagons, hectagons, and so on. The maximum number of edges
that a polygon can have is 40.
Notes:
- Unlike most other tools, the polygon tool does
not have an interactive mode.
- The size of the polygon can be defined either
by specifying the edge length or radius.
To draw a polygon
- From the menu,
choose .
Tip:
You can also click the Polygon tool
on the Draw toolbar.
 The Polygon
button.
The Polygon
button.
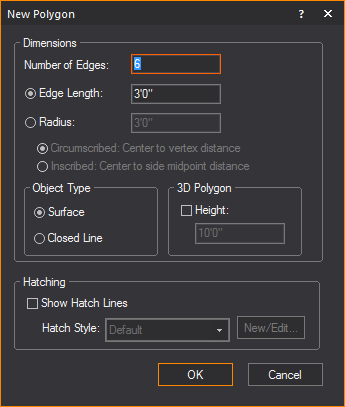
- In the Number of Edges field,
type the number of edges or sides of the polygon.
- Click Edge Length if
you want to define the size of the polygon by the length of its edges,
and then type the value in the box provided.
- Click Radius if
you want to define the size of the polygon by the distance between
the center and the vertices or the edges' midpoints, and then type
the distance in the box provided.
- Click Circumscribed if
you want to define the size of the polygon by the distance between
the center and the vertices. This is equal to the radius of the circumscribed
circle.
- Click Inscribed if
you want to define the size of the polygon by the distance between
the center and the edge midpoints. This is equal to the radius of
the inscribed circle.
- Click Surface if
you want to create the polygon as a surface (i.e., a filled in object
to which you can apply a texture, etc.).
- Click Closed Line if
you want to create the polygon as a closed line (i.e., a polygon comprised
of an outline that is open in the middle).
- Click Height if
you want to extrude the polygon into a 3D object, and then type the
height value in the box provided.
- Select the Show Hatch
Lines checkbox to add hatching lines to the polygon.
- Click OK to place
the polygon in your drawing.
Drawing text labels
Before you draw your text labels in CAD
mode, you can select the font that will be used in all labels. You can
choose from any font installed on your computer.
To change the
text label font globally
You can specify the font that you would
like to appear globally in all text labels, both new and existing.
- In any drawing mode, click .
- Click the Fonts
tab.
- Under CAD Text Labels, select the font that you
want to appear in all new text labels from the Font
drop-down list.
- Choose whether you want the letters to appear
bold, underlined, or in italics.
- Click OK.
To draw a text label
- From the menu,
choose .
Tip: You can
also use the Text Label tool on the
Draw toolbar.
 The Text
Label button.
The Text
Label button.
Result: The
New Text Label window appears.
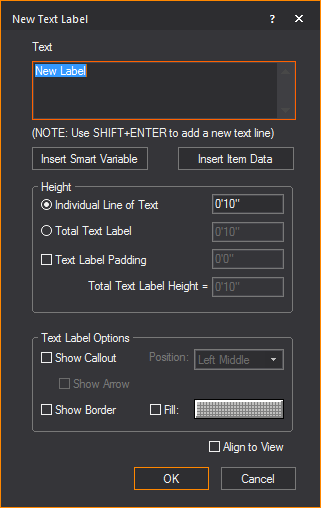
- In the Text box
of the New Text Label window, type
the desired text.
Notes:
- Use SHIFT+ENTER to add new text lines.
- You may include text labels containing information
listed in the Production Team Information table. Use smart variables
“%Variable Name%” in the Text Label box
and this information will automatically be displayed if it is stored
in the Production Team Information table. For example, type “%Director%” and the name of the Director stored
in the table will appear in the Text Label.
- Click Insert Smart Variable to
open the Smart Variables window
where you can select the smart variable names and values that are
listed in the Production Team Info tab
in Document Options.
Result: The
Smart Variables window appears.
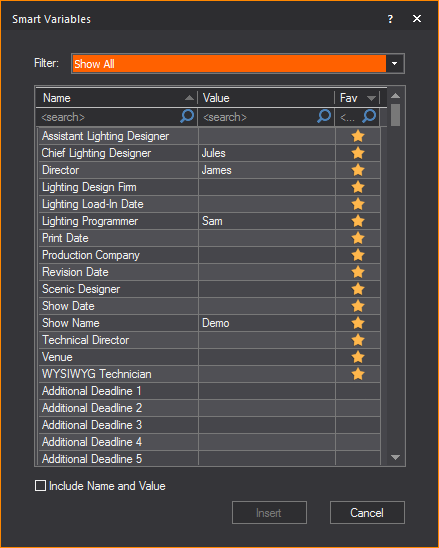
- From the table in the Smart
Variables window, click on the name or value that you
wish to insert in the text box.
Tip: Select
which information to display in the table from the Filter
drop-down list. For information on Smart Variables, see Smart
cells.
- Select the Include Name
and Value checkbox to display both texts under the Name
and Value columns, or clear the checkbox to display only the texts
under the value column.
- Click Insert.
Result: The
smart variable text appears in the Text box
of the New Text Label window.
- Click Insert Item Data to
open the Item Data window, where
you can select retrieved catalog name and other information of fixtures
and trusses, to insert in your drawing.
The retrieved information are displayed
in the Item Data window only after
Retrieve Item Data is initiated from
the > menu in CAD, and then clicking the Fixture or Truss item.
See To
retrieve data from a fixture or truss object.
Result: The
Item Data window appears.
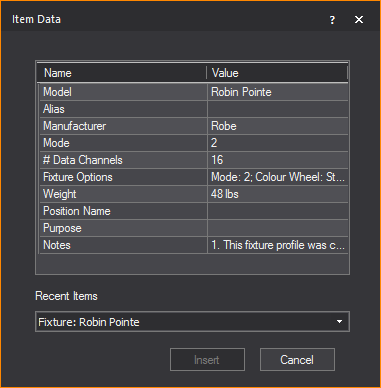
- From the table in the Item
Data window, click on the row that contains the name and
value text that you wish to add into the text box.
- In the Item Data window,
you can select the fixture or truss item from the Recent
Items drop-down list. The Recent
Items drop-down list displays a maximum of five items
recently selected.
- Click Insert.
Result: Information
from the selected fixture or truss appears in the Text box
of the New Text Label window.
- Using the radio buttons, choose how you want to
specify the Height of the Text Label, and enter the value in the corresponding
field.
- Individual Line of Text: Each line of text will be the chosen
height. The text label will change size to accommodate the height.
- Total Text Label:
The total text box will be the chosen height. Text will change size
to accommodate the height.
- To add space between the text and the border
of the text label, select the checkbox next to Text
Label Padding, and enter the value of the padding in the field.
Note: The
Total Text Label Height field will
tell you the exact height of the text label based on your choices.
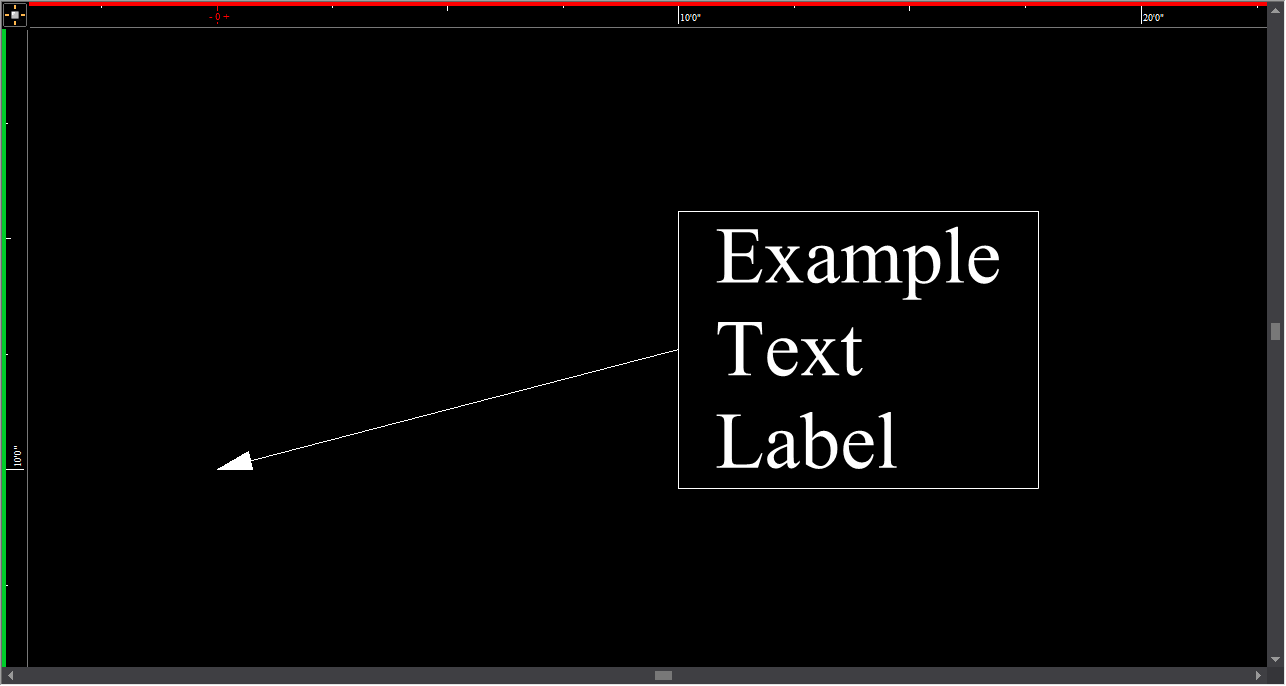
- To add a callout to the text label, select the
Show Callout checkbox.
- From the Position drop-down
list, select where the callout will be located on the text label.
- To have an arrow at the end of the callout, select
the Show Arrow checkbox.
- To add a border to the text label, select the
Show Border checkbox.
- To fill the text label with color, select the
Fill checkbox.
- Click the Color Selector
button to choose the color that will fill the text label.
- To align the text label to the current view, select
the Align to View checkbox.
- To insert the text label, click OK.
Result: The
New Text Label window closes and you
will be in the Wireframe view.
Note: If the
Callout checkbox was selected in the
New Text Label window, the first click
in Wireframe view will be the arrow's
position, and the second position will place the text label.
- Click on the drawing to place the text label.
Result: The
text label will be placed.
Notes:
- To change the font of existing text labels in
CAD mode, see To
change the font of text labels below.
- The insertion point for the text label is at
the intersection of the crosshairs.
To change the font of text
labels
To change the font and appearance (bold,
italic, or underline) of existing labels, you can use the label’s Properties window or the CAD
Text toolbar. The following procedure outlines how to use the Properties window.
- Select the text label whose font you want to change.
- Right-click, and then choose .
- Click the Text Label
tab.
- Under Font, clear the check mark beside Use Document Defaults.
- From the Font drop-down
list, select the new font.
- Choose whether you want the letters to appear
bold, underlined, or in italics.
- Click OK.
To set alignment
for a text label
You can use the alignment buttons on the
CAD Text toolbar to align text labels.

- Select the text label that you want to align.
- On the CAD Text toolbar,
click the appropriate button to align the text label in the desired
position (left, center, right, top, middle, or bottom).
Result: The
text label is relocated around the insertion point, based on the options
selected.
To retrieve data
from a fixture or truss object
- From the menu,
choose .
- Point the cursor to the fixture or truss you want
to select, which highlights the item in orange.
- Click on the fixture or truss item.
Result: The
New Text Label window appears.
- In the New Text Label window,
you can click Insert Item Data to
display in your drawing, the information that you retrieved from the
selected fixture or truss.
Drawing dimension objects
Dimension
lines are 2D objects. They have a start and end point, and measure and
display the distance covered based on the measurement mode selected. The
measurement modes available are: X, Y, XY, XZ, YZ, and XYZ. The dimension
will only be visible in one view type. The view type is set when the dimension
is drawn and is dependent on the plot type and workplane in which the
dimension is drawn.
There are several types of dimensions available:
- :
These dimensions measure and display the distance covered between
two points in your plot, based on the measurement mode selected.
- :
These dimensions display sequential chains of linear measurements
that are aligned to the start (base) measurement of the Continue Dimension,
always using the last point of the previous measurement as the initial
point of the next measurement.
- :
These dimensions display linear measurements stacked above or below
the Base Dimension while maintaining uniform spacing between, always
using the first click as the initial coordinate for all subsequent
measurements.
- :
These dimensions are used to measure the length of arcs drawn in CAD
mode.
- :
These dimensions are used to measure the radius of any circle or arc
drawn in CAD mode.
- :
These dimensions measure and display an angle, either between two
intersecting lines and objects, or as drawn in Freehand mode.
Note: The properties
of dimension objects, such as the arrow type, can be changed in the Dimensionstab
under
To draw a linear dimension
- From the menu,
choose > .
Tip: You can also click the
Linear Dimension tool
on the Draw
toolbar.
 The Linear Dimension
button.
The Linear Dimension
button.
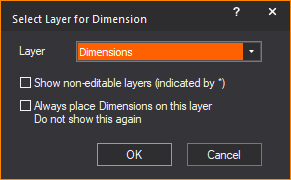
Result: The
Select Layer for Dimension dialog box appears.

- In the Select Layer for
Dimension dialog box, choose the layer for the linear
dimension and select the options for the selected layer.
- Click OK to apply
and close the dialog box.
- Click on the drawing to set the dimension start
point.
- Right-click to set the measurement mode.
Tip: In measurement
mode, you can choose Multiple, which enables
you to draw multiple Linear Dimensions, using the last point of the previous
measurements as the initial point for the next measurement.
- Click on the drawing to set the dimension end
point.
- Click and drag the grab point in the center of
the dimension text to drag the text to the correct side of the object,
if required.
- Click to set the dimension line.
Notes:
- Use snaps to connect dimensions directly to other
objects.
- You can set the rotation angle of the Linear
Dimension to rotate the extension lines around the dimension end points.
The rotated Linear dimension will then display the distance between
the two points at the angle specified. Right-click on the Linear Dimension
and select .
- You can change the Fill color behind the dimension
text of the Linear Dimension. Right-click the Linear Dimension and
select .
- You can enable Display
Dash in >
tab to display the linear
dimensions with a dash between foot and inches in imperial measurements
(e.g. 19’-3 11/16”).
- To adjust the font used in all dimensions, from
the menu, choose > . In the
CAD Dimensions area, select the font options to be used in all dimensions.
To draw a continue dimension
- From the menu,
choose > .
Tips:
- You can also click the Continue
Dimension tool on the Draw
toolbar.
 The Continue Dimension button.
- You can also start the Continue Dimension on
an existing Linear Dimension.
Result: The
Select Layer for Dimension dialog box appears.

- In the Select Layer for
Dimension dialog box, choose the layer for the continue
dimension and select the options for the selected layer.
- Click OK.
Result: The Dimension Draw Options dialog box appears.
- In the Dimension Draw
Options dialog box, select the Use
Document Defaults checkbox to use the default setting
for extension height or clear the Use Document
Defaults checkbox and type the custom Extension
height for the Continue Dimension.
- Click OK to apply
and close the dialog box.
- Click on the drawing to set the dimension start
point.
- Click on the drawing to set the next point and
direction of the subsequent measurements in the Continue Dimension.
- Repeat setting the next point and direction to
continue on the subsequent dimensions.
- Right-click on the drawing to set the dimension
end point.
Note: After
completing a Continue Dimension, the measurements created are individual
Linear Dimensions.
To draw a baseline dimension
- From the menu,
choose > .
Tips:
- You can also click the Baseline
Dimension tool on the Draw
toolbar.
 The Baseline Dimension button.
- You can also start the Baseline Dimension on
an existing Linear Dimension.
Result: The
Select Layer for Dimension dialog box appears.

- In the Select Layer for
Dimension dialog box, choose the layer for baseline dimension
and select the options for the selected layer.
- Click OK.
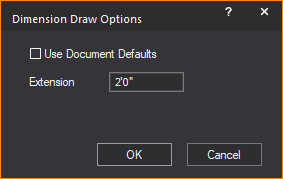
Result: The
Dimension Draw Options dialog box appears.
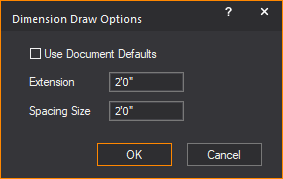
- In the Dimension Draw
Options dialog box, select the Use
Document Defaults checkbox to use the default settings
for extension height and spacing size for the baseline dimension.
Or you may clear the Use Document Defaults
checkbox and type custom values for the Extension height
and Spacing Size for the Baseline Dimension.
- Click OK to apply
and close the dialog box.
- Click on the drawing to set the dimension start
point.
- Click on the drawing to set the end point of the
first Baseline Dimension.
- Click on the drawing to set the position (above
or below) for the next/subsequent Baseline Dimension.
- Click on the next point to complete the next Baseline
Dimension measurement, and set the direction of the subsequent measurement.
- Repeat setting the next point to create the subsequent
Baseline Dimensions.
- Right-click on the drawing to set the dimension
end point.
Note:
After completing a Baseline Dimension, the measurements created
are individual Linear Dimensions.
Arc
length dimensions
The arc length can be displayed for any
arc drawn in CAD mode. Once enabled, the arc length dimension is attached
to the arc and automatically updates itself whenever the arc is changed.
The dimension is only visible in the view type in which it was drawn.
Although the arc length dimension is attached
to the arc, it is a separate entity. Each arc length is individually selectable
and has its own properties. Arc length dimensions can be separated onto
their own layers, and given their own colors and line weights.
To draw an arc length dimension
- In a CAD wireframe, select the arc for which you
want to display an arc length dimension.
- From the menu,
choose > .
 The Arc Length Dimension button.
Tip: To adjust
the font used in all dimensions and with the Angle Dimension tool, click
.
In the CAD Dimensions area, select the font options to be used in all
dimensions and with the Angle Dimension tool.
Radial
dimensions
The radius of a circle/arc is defined as
the distance from the center of a circle/arc to its perimeter. The radius
can be displayed for any circle or arc drawn in CAD mode. Once enabled,
the radial dimension attaches to the circle/arc and automatically updates
itself whenever the circle/arc is changed. Note that the dimension is
only visible in the view type in which it was drawn.
Although the radial dimension is attached
to the arc, it is a separate entity with its own properties and can be
individually selected. Radial dimensions can be separated onto their own
layers, and given their own colors and line weights.
To draw a radial dimension
- In a CAD wireframe, select the circle/arc for
which you want to display a radial dimension.
- From the menu,
choose > .
 The Radial Dimensionbutton.
Tip: To adjust
the font used in all dimensions and with the Angle Dimension tool, from
the menu, choose. In the CAD Dimensions area, select the font
options to be used in all dimensions and with the Angle Dimension tool.
Angle dimension
The Angle Dimension object measures and
displays an angle, either in Line Select,
between two intersecting lines and objects, or as drawn in Freehand mode.
To draw an angle dimension in line select
- From the menu,
choose > .
 The Angle
Dimension button.
The Angle
Dimension button.
- Choose Line Select from
the Dimension Draw Options dialog box.
- Click on the first line segment in the drawing.
- Click on the second line segment in the drawing.
Result: The
angle between the two selected lines is displayed.
To draw an angle dimension
in freehand
- From the menu,
sub-menu, select .
- Choose Freehand in
the Dimension Draw Options dialog box.
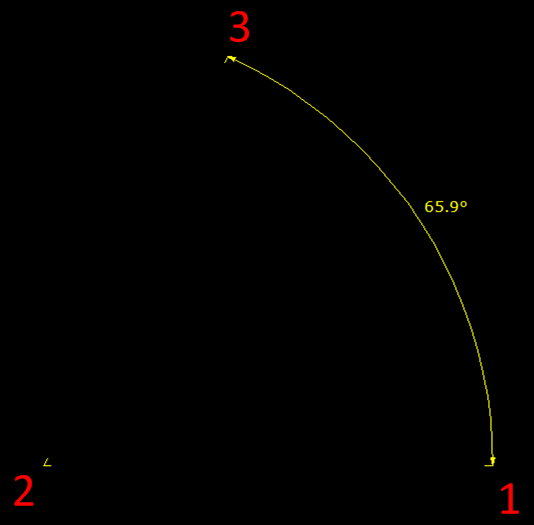
- Click on the drawing to define the first end point
(point number 1 in the diagram above) of the Angle Dimension.
- Click a second time to define the vertex of the
angle (this is the point at which the two lines of your angle meet,
shown as point number 2 in the diagram above).
- Click a third time to define the second end point
(point number 3 in the diagram above).
Result: The
new object displays the interior (or exterior) angle defined by the arc
between the end points of the Angle Dimension.
Tips:
- You can change the angle option of measuring
the exterior or interior angle by toggling the Flip
Angle checkbox in the Angle Dimension Properties page.
Simply right-click the Angle Dimension, and choose Angle Dimensiontab.
- To adjust the font used in all dimensions and
with the Angle Dimension tool, click Fonts.
In the CAD Dimensions area, select the font options to be used in
all dimensions and with the Angle Dimension
tool.
Linear
scales
A Linear Scale is a visible line divided
into equal proportions used to compare distances in WYSIWYG wireframe
to actual distances.
To draw a linear scale
- From the menu,
choose > .
 The Arc Length Dimension button.
Result: The
New Linear Scale window appears.
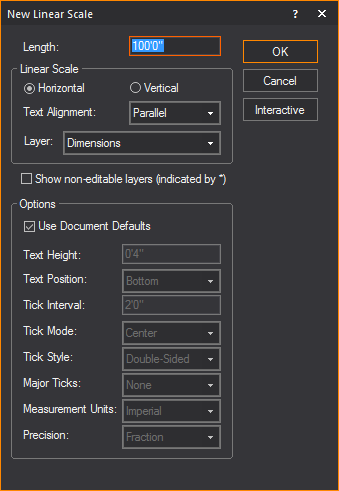
- In the Length field,
enter in the desired length of the linear scale.
- Select either Horizontal or
Vertical to determine how the
line scale is positioned.
- From the Text Alignment drop-down
list, choose how the linear scale text will be presented.
- From the Layer drop-down
list, choose in which layer the linear scale will be visible.
- Selecting the checkbox next to Show
non-editable layers (indicated by *) will show non editable
layers in the Layer drop-down list.
- To change the default document settings of the
linear scale, clear the checkbox next to Use
Document Defaults.
- Click OK.
Result: The
linear scale is attached to the cursor.
- Click to place the linear scale in the drawing.
Auto
truss dimension
When Auto Truss Dimension is applied, truss
objects that are selected in the drawing will be displayed with linear
dimensions automatically, and with the option of showing values that were
set in Truss Manager or the default
values from the Library. See Truss
Manager.
To apply auto truss dimension
- In Wireframe, select the truss object(s).
- From the menu,
choose > .
Result: The
Select Layer for Dimension dialog
box appears.
- Select the layer and the options in the Select Layer for Dimension dialog box.
- Click OK.
Result: The
Auto Truss Dimension window appears.
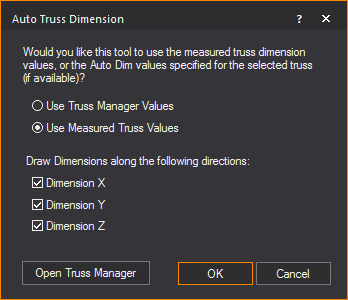
- Select the Use Truss Manager
Values checkbox to apply the values that were set in Truss
Manager or select Use Measured Truss Values to
apply manually applied linear dimensions.
- Select the checkboxes for Dimension
X, Dimension Y, and/or Dimension Z to specify which dimensions
of a truss to add into your drawing.
- Click Open Truss Manager to
launch Truss Manager.
- Click OK.
Result: The
truss object(s) that were selected in your drawing are displayed with
the linear dimensions showing the values set in Truss
Manager if Use Truss Manager Values was
selected. The manually applied linear dimension values will be displayed
if Use Measured Truss Values was selected.
Drawing surfaces
Surfaces are 2D objects. Surfaces are drawn
continuously, stretching out behind the cursor and can be used to create
backdrops or other flat objects. Surfaces can be extruded to create odd
shaped risers, or other custom shaped 3D objects. For more information
on extruding, see Extrude.
When you draw multi-segmented lines or
surfaces, the new line or surface snaps automatically to the previously
drawn line or surface's endpoint, midpoint or intersection when the Endpoint Snap, Midpoint
Snap or Intersection Snap are
enabled.
Note: The
beam will pass through a surface with the Transparency value set to 80%
or greater. The beam will not pass through the surface when the value
is lower than 80%. Transparency value is set in the Material Properties section in the Appearance tab
of the Properties window. Refer to
Appearance
tab.
To draw a surface
To ensure that textures, if any, are applied
properly, the surface must be drawn in a counter-clockwise direction.
- From the menu,
choose .
Tip: You can
also click the Surface tool on the
Draw toolbar.
 The Surface
button.
The Surface
button.
- Click on the drawing at the starting point of
the surface.
- Moving in a counter-clockwise direction, drag
to the next point of the surface and click.
- Continue to place points for the surface as needed,
always moving counter-clockwise. In the following graphic, the starting
point is labelled A:
- To finish and close the surface, right-click and
choose from the sub-menu. To abort the surface entirely,
choose . This erases the
whole surface from the drawing.
Surfaces
as curtains
Vertical surfaces can have their appearance
changed to mimic the look of curtains in 2D Plan View. The curtain will
appear as a wave or semicircles pattern, instead of the usual straight
line of a surface. The depth, width and number of segments in the curtain
pattern can be customized.
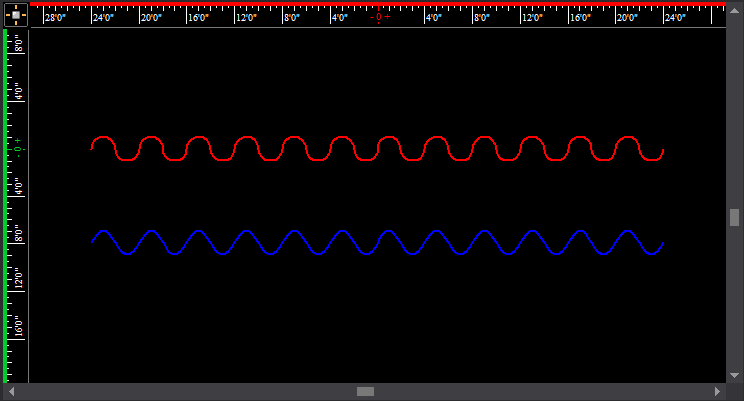
A Plan View of an example surface with a semicircle
curtain enabled in red, and a surface with a wave curtain enabled
in blue.
Note: Curtains
are limited to being visible only in 2D Plan View, with a surface that
is vertical and rectangular in shape, with no surface area visible in
Plan View.
To display a surface as a curtain.
- Right-click an eligible surface and select .
- In the Properties window,
click the Surface tab.
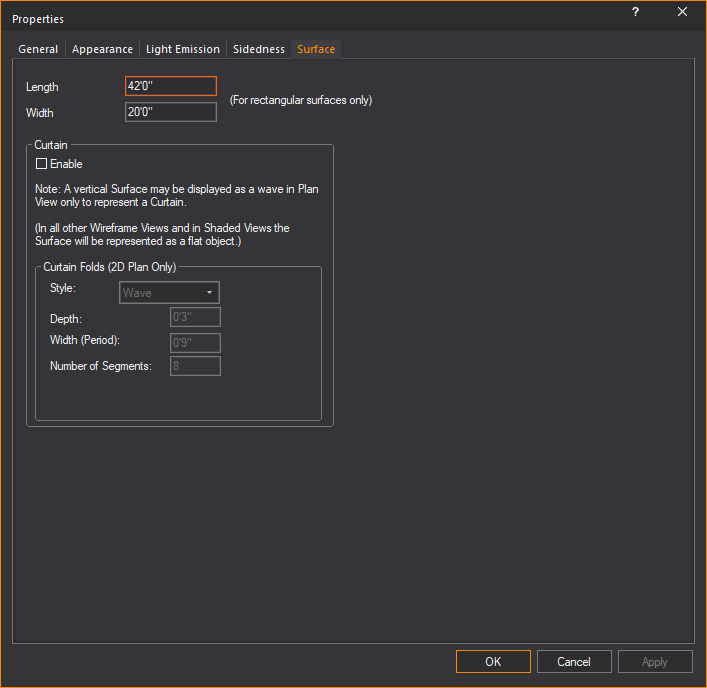
- To enable the curtain feature for the surface,
select the checkbox labeled Enable.
Note: If the
surface is ineligible to be a curtain, this option will be greyed out.
- From the Style drop-down
list, select which pattern of curtain should be displayed.
- Enter the desired depth of the curtain pattern
in the Depth field.
- Enter the desired width of the curtain pattern
in the Width field.
- Enter the desired number of segments in the curtain
pattern in the Number of Segments field.
- Click Apply.
Drawing rectangular
surfaces
Rectangular surfaces are 2D surface objects
that always retain their rectangular shape when their dimensions change.
You can draw a rectangular surface by drawing a surface with four (4)
90° right angle corners
or you can use the New Rectangle tool and
select the Convert to Surface option.
There are three ways to draw a rectangular
surface:
- Surface tool from
the Draw menu/toolbar and draw the
rectangular surface freehand.
- Non-interactive mode in the New
Rectangle window where you specify the width, height, convert
to surface option, and place the rectangular surface in the drawing.
- Interactive mode in the New
Rectangle window where you select the convert to surface option
and draw the rectangular surface freehand.
To draw a rectangular surface freehand
- From the menu,
choose .
Tip: Enable
Grid Snap or Mid-Grid
Snap and/or enable Ortho to make
it easier to create the required 90°
corners.
- Click on the drawing at the starting point of
the surface.
- Moving in a counter-clockwise direction, drag
to the next point of the surface while maintaining a 90° angle corner and click or type
coordinates and press ENTER.
- Continue to place points to complete the rectangular
surface shape while maintaining 90°
angle on all the corners.
- To finish and close the surface, right-click and
choose from the sub-menu. Choose to abort and erase the whole surface from the drawing.
Note: To
draw a rectangular surface from the New Rectangle
tool in interactive and non-interactive mode, see the previous section
(above) Drawing_rectangles.
Tip: You
can change the Length and Width
of the rectangular surface by clicking and dragging the grips that appear
while it is selected, or via the Surface
tab of its Properties window.
Drawing
walls
Walls are 2D objects that describe flat
rectangular planes representing walls in your drawing. Walls can have
different hatching styles for easy identification in the plot.
There are two ways to draw a wall:
- Non-interactive mode in which you specify the
width and height and place the wall in the drawing.
- Interactive mode where you draw the wall freehand.
To draw a wall in non-interactive mode
- From the menu,
choose .
Tip: You can
also click the Wall tool on the Draw toolbar.
 The Wall
button.
The Wall
button.
Result: The
New Wall window appears.
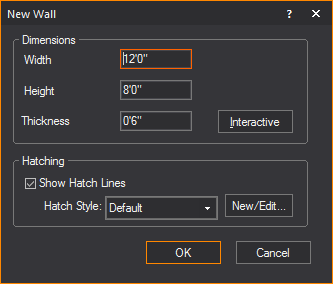
- In the Width box,
enter the width for the wall. The default value is 12’0”.
- In the Height box,
enter the height of the wall. The default value is 8’0”.
- In the Thickness box,
enter the thickness of the wall. The default value is 0'6"
- To enable hatching for the object, select the
Show Hatch Lines checkbox.
- Select the desired hatching style for the object
from the Hatch Style drop-down list.
- Click OK.
Result: The
wall attaches to the cursor.
- Move the cursor to the desired position for the
wall, and then click to place it in the drawing.
To draw a wall in interactive mode
Note: To turn interactive
mode on, click the Interactive Mode button
on the toolbar.
 The Interactive
Mode button.
The Interactive
Mode button.
- From the menu,
choose .
- Click to place the start point of the wall.
- Click to place the end point of the wall.
- In the dialog box that opens, enter the missing
dimension of the wall.
- Click OK.
To define the transparency of a wall
- Right-click a wall, and select .
Result: The
Propertieswindow
appears.
- In the Properties window,
click the Wall tab.
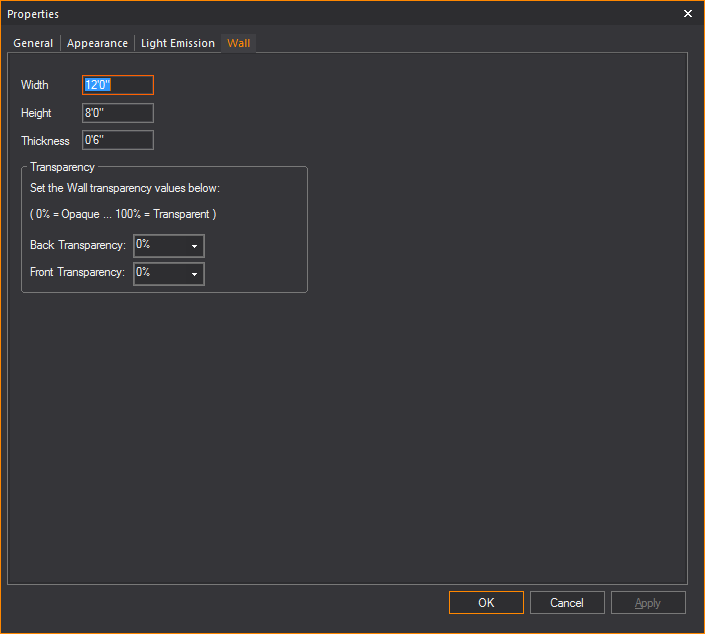
Note: 0% =
Opaque, 100% = Transparent.
- To change how the back of the wall will look,
set the Back Transparency field
to the desired transparency percentage.
- To change how the front of the wall will look,
set the Front Transparency field
to the desired transparency percentage.
- Click Apply to
enable the new wall transparency settings.
- Click OK.
Drawing
risers
Risers are solid 3D rectangular objects.
You can use risers for creating platforms, square columns, or any other
box-shaped objects.
There are two ways in which you can draw
risers:
- Non-interactive mode in which you type the exact
width, depth, and height of the riser.
- Interactive mode in which you click and drag to
set the dimensions of the riser.
To draw a riser in non-interactive mode
- From the menu,
choose .
Tip: You can also click the
Riser tool
on the Draw
toolbar.
 The Riser
button.
The Riser
button.
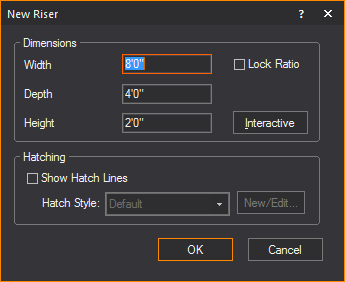
Note: To ensure
that the riser remains proportionately the same when resized, leave the
Lock Ratio checkbox
checked. If you clear this checkbox, then you can manually resize the
riser in any direction, regardless of its original measurements.
- In the Width box,
type the width for the riser. The default value is 8’0”
- In the Depth box,
type the depth for the riser. The default value is 4’0”.
- In the Height box,
type the height for the riser. The default value is 2’0”.
- To enable hatching for the object, select the
Show Hatch Lines checkbox.
- Select the desired hatching style for the object
from the Hatch Style drop-down list.
- Click OK.
Result: The
riser is attached to the cursor.
- Drag the new riser to its position, and then click
to place it in the drawing.
To draw a riser in interactive mode
Note: To turn
interactive mode on, click the Interactive Mode button
on the toolbar.
 The Interactive Mode button.
- From the menu,
choose .
- Click the starting point of the riser on the drawing.
The insertion point is the lower left corner of the riser.
- Drag in any direction to stretch out the riser’s
shape. Click to place the upper right corner of the riser.
- In the dialog box that opens, type the missing
dimension of the riser.
- Click OK.
Note: You
can snap to all eight points on a riser: top corners and bottom corners.
Drawing
cylinders
Cylinders are solid 3D objects. Cylinders
can be used for creating platforms, columns, or any other cylinder-shaped
objects.
There are two ways in which you can draw
cylinders:
- Non-interactive mode in which you type the exact
height and radius of the cylinder.
- Interactive mode in which you click and drag to
set the dimensions of the cylinder.
To draw a cylinder
- From the menu,
choose .
Tip:
You can also click the Cylinder tool
on the Draw toolbar.
 The Cylinder button.
Result: The
New Cylinder window appears.
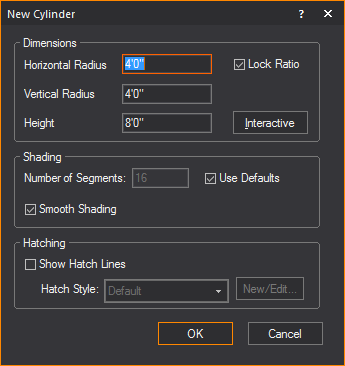
- In the Height box,
type the height for the cylinder. The default value is 8’0”.
- In the Horizontal Radius box,
type the horizontal radius for the cylinder. The default value is
4’0”.
- In the Vertical Radius box,
type the vertical radius for the cylinder. The default value is 4’0”.
- To ensure that the cylinder remains proportionately
the same when resized, leave the Lock Ratio checkbox
checked. If you clear this checkbox, then you can manually resize
the cylinder in any direction, regardless of its original measurements.
- To have the cylinder appear smooth in the Shaded
view, leave the Smooth Shading option
enabled; to see a faceted cylinder in the Shaded view, disable this
option. The default for this option is ON.
- To change the default number of cylinder segments,
clear the checkbox beside Use Defaults and
type the new number of segments. Note that the higher the number of
segments, the better the cylinder will appear in Shaded view, but
the more performance will degrade.
- To enable hatching for the object, select the
Show Hatch Lines checkbox.
- Select the desired hatching style for the object
from the Hatch Style drop-down list.
- Click OK.
Result: The
cylinder is attached to the cursor.
- Drag the new cylinder to its position, and then
click to place the object in the drawing.
To draw a cylinder
in interactive mode
Note: To turn
interactive mode on, click the Interactive Mode button
on the toolbar.
 The Interactive Mode button.
- From the menu,
choose .
- Click to place the center of the bottom surface
of the cylinder.
- Click to set the radius for the cylinder.
- In the dialog box that opens, type the desired
height, horizontal radius and vertical radius for the cylinder.
- To ensure that the cylinder remains proportionately
the same when resized, leave the Lock Ratio checkbox
checked. If you clear this checkbox, then you can manually resize
the cylinder in any direction, regardless of its original measurements.
- To have the cylinder appear smooth in the Shaded
view, leave the Smooth Shading option
enabled; to see a faceted cylinder in the Shaded view, disable this
option. The default for this option is ON.
- To change the default number of cylinder segments,
clear the Use Defaults checkbox
and type the new number of segments. Note that the higher the number
of segments, the better the cylinder will appear in Shaded view, but
the more performance will degrade.
- Click OK.
Drawing spheres
Spheres are solid 3D circular or oval objects.
There are two ways in which you can draw
spheres:
- Non-interactive mode in which you type the exact
horizontal radius, depth radius and vertical radius of the sphere.
- Interactive mode in which you click and drag to
set the dimensions of the sphere.
To draw a sphere
in non-interactive mode
- From the menu,
choose .
Tip:
You can also click the Sphere tool on the Draw
toolbar.
 The Sphere
button.
The Sphere
button.
Result: The
New Sphere window appears.
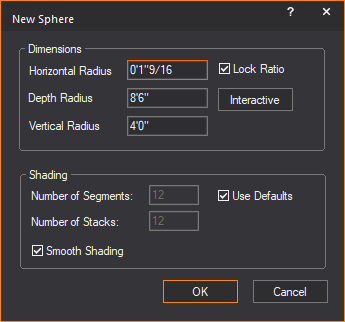
- In the Horizontal Radius box, type the horizontal radius
for the middle of the sphere.
- In the Depth Radius box,
type the depth radius for the middle of the sphere.
- In the Vertical Radius box, type the vertical radius
for height of the middle of the sphere.
- To ensure that the sphere remains proportionately
the same when resized, leave the Lock Ratio checkbox
checked. If you clear this checkbox, then you can manually resize
the sphere in any direction, regardless of its original measurements.
- To change the default number of sphere segments
and stacks, clear the Use Defaults checkbox
and type the new values for Number of Segments and
Number of Stacks. Note that the higher
the number of segments or stacks, the better the sphere will appear
in Shaded view, but the more performance will degrade.
- To have the sphere appear smooth in the Shaded
view, leave the Smooth Shading option
enabled; to see a faceted sphere in the Shaded view, disable this
option. The default for this option is ON.
- Click OK.
Result: The
sphere is attached to the cursor.
- Click to place the sphere in the drawing.
To draw a sphere in interactive mode
- From the menu,
choose .
Tip: You can
also click the Sphere tool on the
Draw toolbar.
 The Sphere
button.
The Sphere
button.
- In the New Sphere window,
click Interactive.
- Click and drag out the shape of the sphere in
your drawing. When you have the desired size, click again.
Result: The
New Sphere window appears again.
- In the New Sphere dialog
box, you can change the default Horizontal
Radius, Depth Radius, and Vertical Radius of the new sphere.
- To ensure that the sphere remains proportionately
the same when resized, leave the Lock Ratio checkbox
checked. If you clear this checkbox, then you can manually resize
the sphere in any direction, regardless of its original measurements.
- To change the default number of sphere segments
and stacks, clear the Use Defaults checkbox
and type the new values for Number of Segments and
Number of Stacks. Note that the higher
the number of segments or stacks, the better the sphere will appear
in Shaded view, but the more performance will degrade.
- To have the sphere appear smooth in the Shaded
view, leave the Smooth Shading option
enabled; to see a faceted sphere in the Shaded view, disable this
option. The default for this option is ON.
- Click OK.
Drawing
cones
Cones are solid 3D objects.
There are two ways in which you can draw
cones:
- Non-interactive mode in which you type the exact
horizontal and vertical radius of the cone.
- Interactive mode in which you click and drag to
set the dimensions of the cone.
To draw a cone
in non-interactive mode
- From the menu,
choose .
Tip:
You can also click the Cone tool on the Draw
toolbar.
 The Cone button.
Result: The
New Cone window appears.
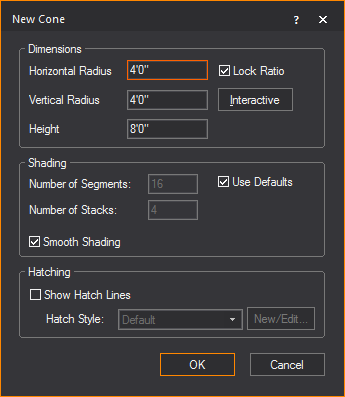
- In the Height box,
type the height of the cone.
- In the Horizontal Radius box, type the horizontal radius for
the cone.
- In the Vertical Radius box, type the vertical radius for
the cone.
- To ensure that the cone remains proportionately
the same when resized, leave the Lock Ratio checkbox
checked. If you clear this checkbox, then you can manually resize
the cone in any direction, regardless of its original measurements.
- To change the default number of cone segments
and stacks, clear the Use Defaults checkbox
and type the new values for Number of Segments and
Number of Stacks. Note that the higher
the number of segments or stacks, the better the cone will appear
in Shaded view, but the more performance will degrade.
- To have the cone appear smooth in the Shaded view,
leave the Smooth Shading option
enabled; to see a faceted cone in the Shaded view, disable this option.
The default for this option is ON.
- To enable hatching for the object, select the
Show Hatch Lines checkbox.
- Select the desired hatching style for the object
from the Hatch Style drop-down list.
- Click OK.
Result: The
cone is attached to the cursor.
- Click to place the cone in the drawing.
To draw a cone in interactive mode
- From the menu,
choose .
Tip: You can also click the
Cone tool
on the Draw
toolbar.
 The Cone
button.
The Cone
button.
- In the New Cone window,
click Interactive.
- Accept the default values, and then click and
drag out the shape of the cone in your drawing. When you have the
desired size, click again.
Result: The
New Cone window appears again.
- In the dialog box that opens, type the height
and the horizontal and vertical radius of the new cone.
- To ensure that the cone remains proportionately
the same when resized, leave the Lock Ratio checkbox
checked. If you clear this checkbox, then you can manually resize
the cone in any direction, regardless of its original measurements.
- To change the default number of cone segments
and stacks, clear the Use Defaults checkbox
and type the new values for Number of Segments and
Number of Stacks. Note that the higher
the number of segments or stacks, the better the sphere will appear
in Shaded view, but the more performance will degrade.
- To have the cone appear smooth in the Shaded view,
leave the Smooth Shading option
enabled; to see a faceted cone in the Shaded view, disable this option.
The default for this option is ON.
- To enable hatching for the object, select the
Show Hatch Lines checkbox.
- Select the desired hatching style for the object
from the Hatch Style drop-down
list.
- Click OK.
- Click in the drawing to finish placing the new
cone.
Drawing pipes
For information on drawing pipes and curved
pipes, see Drawing
pipes in the “Hang Structures” section.
Drawing rigging
points
For information on drawing rigging points,
see Drawing
rigging points in the “Hang Structures” section.
Drawing
focus objects
For details on drawing focus objects, such
as focus positions, focus lines and focus arcs, see Focus
objects
in the “Hanging and focusing fixtures” section.
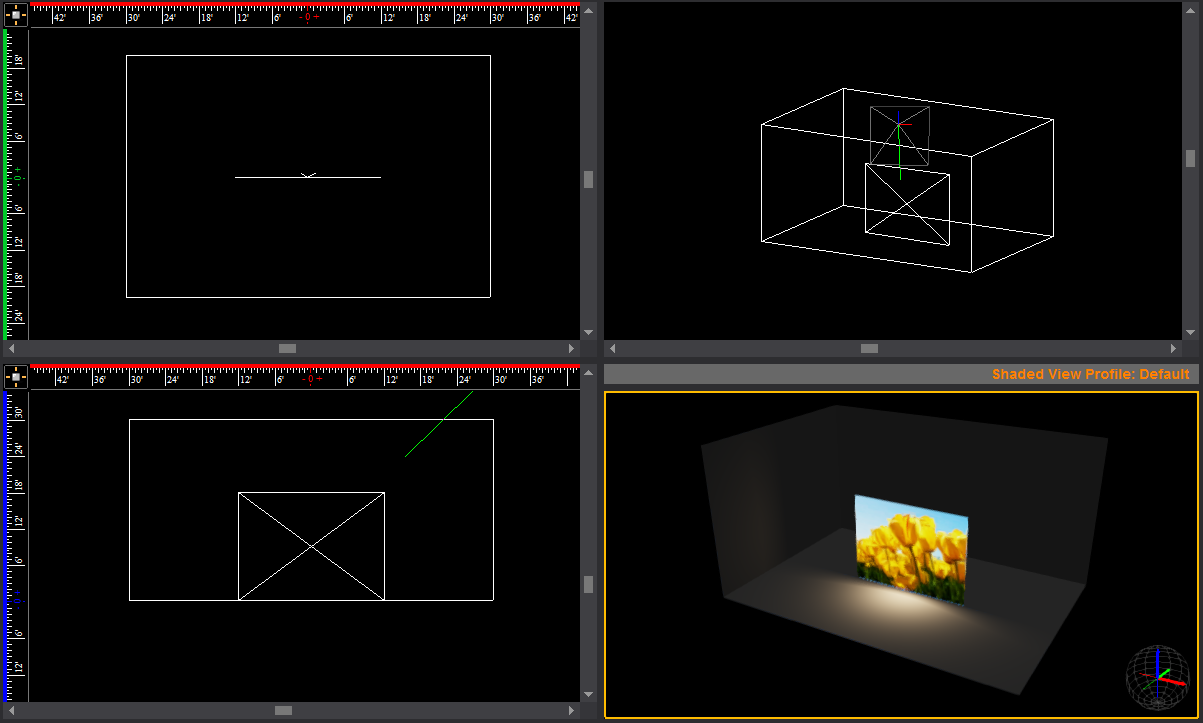
Drawing screens
You can draw a screen and then attach an
image or video source or subsource to it.
Tip: To
achieve the best visualization of screen projections in Shaded view, enable
Global Illumination and select Approximation
Method 2 on the Visual Effects tab
of the View Options window in Shaded view.
To draw a screen
- From the menu,
choose .
 The
Screen button.
The
Screen button.
Result: The New Screen window appears.

- In the appropriate fields, enter the width and
height of the screen.
- To configure the image that will appear on the
screen, click the appropriate option button:
- To leave the screen blank, click the Blank
Screen option button.
- To show a static image on the screen, follow
the procedures in the Image Manager section. For details, see Image
Manager.
- To attach a video source to the screen, click
the Video Source option button,
and from the drop-down list, choose the video source or video subsource,
or an I-Mag screen from a WYSIWYG Camera, (or click Create
New to configure a new video source with the Video Manager).
For details on creating a new video source, see To
configure a new video source for streaming video. For details
on splitting video into subsources, see To
create a single video subsource. For details on creating
an I-Mag Camera source, see To
create an I-Mag camera in the Video Manager.
- Click OK.
Result: The
screen is placed into the drawing.
Creating video walls
with screens
After a screen has been created, the Grid
Array tool can be applied to build a video wall. Applying Grid Array opens
the Quick Image/Video Tool where you
can set the video/image sources to the screen panels that were created.
To create video walls with screens
- In Front or Back view in Wireframe,
select the screen.
- From the menu,
choose > .
Result: The
Grid Array window appears.
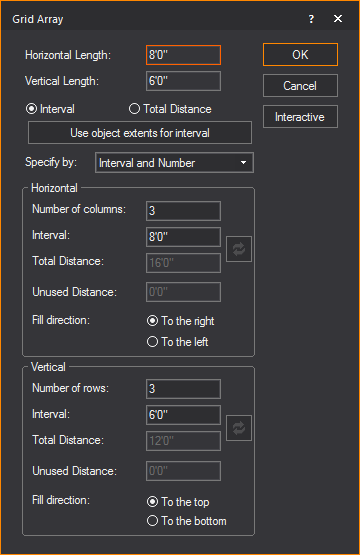
- In the Grid Array window,
modify the settings as desired. Refer to Array
for information on Grid Array settings.
- Click OK.
Result: The
Quick Image/Video Tool appears.
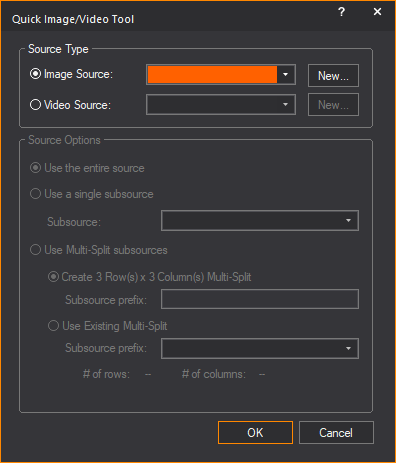
- In the Quick Image/Video
Tool window, specify the video or image sources and subsources
for the video wall that was created.
- Click OK.
Result: The
video wall is created with the video or image applied to the individual
screens.
Notes:
- The Quick Image/Video
Tool can be applied to previously drawn screen files, if re-arranged
into rows and columns that WYSIWYG can recognize and automatically
apply subsources to the individual screens.
- The Quick Image/Video
Tool can be applied to missing panels in the video wall
if WYSIWYG can recognize the arrangement of rows and columns.
- The functionality of the Quick
Image/Video Tool remains available if no screens are selected.
Screen
properties
After a screen has been created, the properties
of a screen can be altered from the properties menu. The following properties
of the screen can be changed:
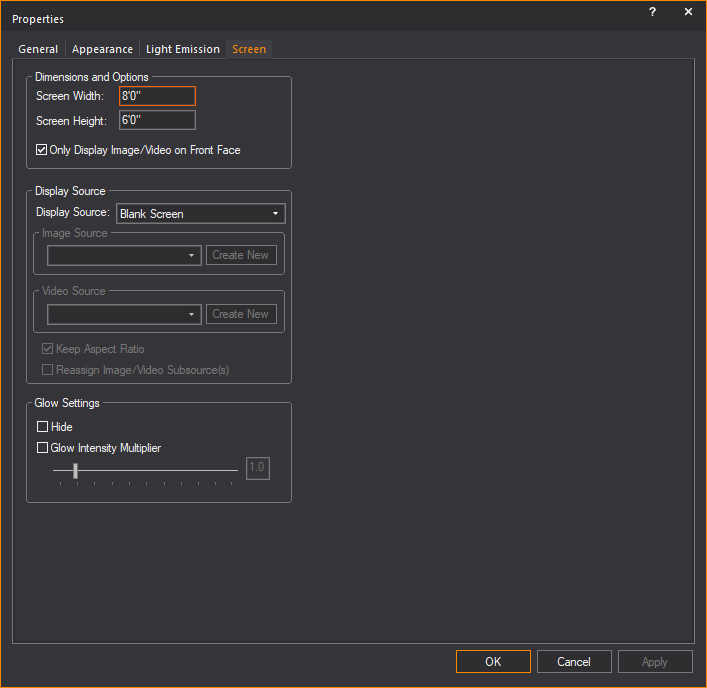
Dimensions and Options
The size of the screen can be changed from
its original dimensions and the option to display the source on the front
side.
- Screen Width: The
width of the screen.
- Screen Height:
The height of the screen.
- Only Display Image/Video
on Front Face: Select this checkbox to set the color, Image
Source, or Video Source to appear only on the front side of the screen.
Note: The
front side of a Screen is the one which does not display the “V” symbol
when the Screen appears in Wireframe set to Plan view.
Tip: The Only Display Image/Video on Front Face option
will help when using the Global Illumination with
Approximation Method 2 Visual Effect;
when this Visual Effect is enabled, the illumination it produces will
only appear on the front side of the Screen.
Display Source
Options for controlling what will be visible
on the screen.
- Display Source:
Drop-down list for selecting what will be visible on the screen.
- Image Source: Available
images that can be displayed on the screen.
- Video Source: Available
videos that can be displayed on the screen.
- Keep Aspect Ratio:
Toggle whether to have images/videos displayed on the screen maintain
their aspect ratio or stretch/constrict when the size of the screen
changes.
- Reassign Video/Image Subsource(s):
This checkbox is available when the screen is set with Multi-split
subsources. Select this checkbox to open the Reassign
Video/Image Subsource dialog box and reassign the video
and image source types and options for the screen.
Glow Settings
Setting for controlling the glow of the
selected screen, independent of the global settings.
Note: The
glow effect will appear only on the screen’s front face if Only
Display Image/Video on Front Face is selected.
- Hide: Toggle to
enable/disable the screen glow feature.
- Glow Intensity Multiplier:
When enabled can enhance the glow of the screen on a scale of 0 to
10.
Drawing cameras
You can add cameras to the drawing to provide
additional view points in Shaded views and renderings. Place cameras at
specific locations, for example, at the Front of House, at extreme Audience
Left/Right (to check sightlines), at IMAG camera locations, or camera
placement to shoot the show in real-time.
For tips on moving your cameras, see Camera
control in shaded view.
To insert a camera
The following procedure outlines how to
insert a camera in a Wireframe view. For information on creating a camera
directly from the Shaded view, see To
create a camera from shaded view.
- From the menu,
choose > .
Result: The
New Camera properties dialog box appears.
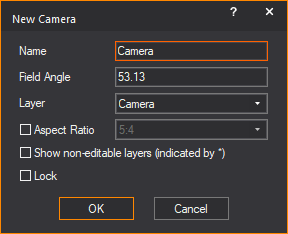
- Type a name for the camera and a value in degrees
for the field angle. The default value for the field angle is 53.13.
- From the Layer drop-down
list, select the layer of your file on which you want to draw the
camera. By default, the Camera object is inserted on the Camera layer.
Note: If you
do not see all layers in the Layer drop-down
list, click Show non-editable layers.
- (Optional) Select the
Aspect Ratio checkbox to set a fixed Aspect Ratio for
the new camera. From the Aspect Ratio drop-down
list, select the fixed Aspect Ratio for the new camera.
Result: The
Shaded view will be defined by the set Aspect Ratio of the selected Camera,
with pillar or letter bars displayed to indicate the viewing definition
boundaries.
- (Optional) Select the Lock checkbox
to lock this new camera in its position and view angle in Shaded view.
- Click OK to
apply the settings or Cancel to discard.
- Click on the drawing to place the camera.
- Drag the cursor to aim the camera, and then click
to place the target.
Result: The
camera is inserted into your drawing and available in the camera selection
list for Shaded views and renderings.
Tip: Use the
missing coordinate tool while placing the camera and target.
Note: The
target of your camera is easily identifiable in Wireframe views as defined
by the marker points of the camera drawing. Camera drawings are invisible
in Shaded views because you are looking through the
camera. For this reason, in this view you can choose to display the target.
For more information on displaying the target, see Modifying
shaded views or Using
the camera toolbar.
To view or edit
camera properties
- In , ,
or mode, click the Quad
or Shaded tab.
- Right-click on the toolbar area and select .
Result: The
Camera toolbar appears.
- From the Current Camera drop-down
list, select the camera whose Properties you want to view.
- On the Camera toolbar,
click the Camera Properties button.
- In the window that appears, you can change any
of the following properties:
- Name: You can
edit the name that appears on the Camera toolbar
for the selected Camera.
- Field Angle: You
can change the field angle of the currently selected Camera, measured
in degrees.
- Assigned Hotkey:
Click to assign a new numbered hotkey for this Camera. This is the
number that you can press from your Number pad to instantly switch
from one Camera to the next.
- Aspect Ratio:
Select this checkbox and choose a fixed Aspect Ratio for the selected
Camera.
- Lock camera in Shaded
View: Select this checkbox to lock the selected camera in its
current position in all Shaded views. To unlock it, simply select
the camera from the Camera toolbar,
and then press the Camera Lock button.
DMX Patch
In this section,
you can assign a DMX value to the camera when the Assigned
Hotkey is set to None. Select
a value from the Assigned DMX Value drop-down
list.
Note: When a hotkey
of 1-9 is
assigned, the DMX value matching the hotkey number is automatically assigned.
- DMX Patch enables the DMX control of the switching
between Cameras in LIVE mode, instead of using the drop-down list
on the Camera toolbar or the numpad
hotkeys.
- Assigned DMX Value drop-down
list goes from #10-255 (#1-9 are reserved for hot key assignments).
- When the camera has an assigned hotkey, the Assigned DMX Value drop-down list will
display the hotkey value as read-only.
- Enable DMX Control of
Cameras/Camera Paths must be enabled in the Camera
Manager window to enable DMX control of the cameras. Refer
to Camera
Manager.
Drawing camera paths
Camera Paths allow you to define a path
along which the camera will travel during playback in the Shaded view,
either in DESIGN or LIVE Modes. You draw Camera Paths in CAD Mode just
as you would draw a spline. Each vertex point or marker along the path
is called a “Node”.
Note: You
can keep the Camera Path, nodes, and targets visible during file editing,
and once you’re done, go into the Properties of these objects and toggle
their visibility off in Shaded view.
To draw a camera path
- In Wireframe view, from the menu,
choose > .
- Click in your plot where you want to start drawing
the Camera Path.
- Continue clicking in your drawing to create your
path. When you are finished, right-click and select one of the options
on the pop-up menu:
- :
This option finishes the path at the last point, and places it in
your plot.
- :
This option closes the path from one end to the next, and places the
path in your plot.
- :
This option cancels the drawing of the Camera Path altogether.
- :
This option removes the last point of the path.
Note: Camera
Paths are controlled from DESIGN and/or LIVE modes, using the Camera
Path Editor and the Timeline tool.
For details, see Using
the Camera Path Editor.
Camera
path properties
Camera Paths have unique properties, as
shown below:

- Name: Camera Paths
can have unique names
Shaded View Options
- Show Camera Path in Shaded
Views: This option shows or hides the Camera Path in Shaded
views while playing the path.
- Use Layer Rendering Color:
This option controls the color of the Camera Path and its Layer behavior.
- Show Nodes: This
option shows or hides the Nodes along the Camera Path.
- Show Node Numbers:
This option shows or hides the Node numbers along the Camera Path.
CAD Options
- Closed: If checked,
this option enables the Camera Path to play as a continuous loop with
no gaps.
- Tension: A value
between 0 and 1, where 0 is no tension and 1 is maximum tension; this
option enables the Camera Path to allow curving between nodes along
the path. If the Tension is set to 0, the nodes will be connected
with straight lines.
- Camera Path Arrow - Size:
This option allows you to control the size of the direction arrows
on the Camera Path.
Patch
- None: Select this
option if the Camera Path is not patched.
- DMX Patch: Select
this option if the Camera Path is patched, and then enter the patch
properties.
- Aspect Ratio: This
option allows you to select a fixed Aspect Ratio for this Camera Path.
Drawing camera targets
After you draw a Camera Path, you can also
insert a “Camera target” at points of interest where you would like the
camera to focus while traveling along a path.
Note: You
can keep the Camera Path, nodes and targets visible during file editing,
and once you’re done, go into the Properties of these objects and toggle
their visibility off in Shaded view.
To draw a camera target
- In Wireframe view, from the menu,
choose > .
- Type a descriptive name for the camera target.
- Click OK and then
click to place the target along the Camera Path.
Camera
target properties
Camera targets also have unique properties,
as seen below:
- Label: Camera targets
can have unique labels.
- Height: This controls
the height of the text associated with the Camera Target.
- Align to View:
This option aligns the target to the specific view that it is in (i.e.,
Side, Front, Back, Iso)
- Show Label: This
option shows or hides the Camera Target label text.
Shaded View Options
- Show in Shaded Views:
This option shows or hides the Camera Target in Shaded views while
playing the path.
- Use Layer Rendering Color:
This controls the color of the Camera target and its Layer behavior.
Text Justification
This section controls the Horizontal and
Vertical alignment of the text associated
with the Camera Target.
- X, Y, and Z Coordinates:
These options allow you to control the position in 3D space of the
Camera Target.
Font
This section displays options that allow
you control of the font face of the Camera Target. Settings in Document
Defaults are used by default.
In the top image, an example of a path and camera
target is drawn.
In the bottom image, the camera at each node of
the path is now pointing to the camera target.
Drawing a compass
You can add a
compass to a drawing to define the direction that is north. This definition
is important to set the position of the sun and/or moon for renderings
and Shaded views that use environmental options.
Note: There
can be only one compass in a file.
To draw a compass
- From the menu,
choose .
- Click to place the starting point of the compass.
- Click to place the end point of the compass. The
end point must be directly north of the start point.
Result: A
compass is drawn, centered on the start point and pointing towards the
end point.
Notes:
- To remove the compass from the drawing, choose
from the
menu.
- To redefine north, repeat steps 1-3. You do not
need to remove the compass from the drawing when redefining north
as there can be only one compass in a file.