 The
View Options button.
The
View Options button.
New Plots views were introduced so that you could more effectively manipulate a drawing developed in CAD mode to create a lighting plot or “schematic” for printing.
In the New Plots view you can:
Working in a New Plots view is similar in some respects to working with a drawing in a CAD wireframe view. You can use your keyboard and mouse to navigate around the plot easily and quickly. A Command Line interface is available to help you when entering coordinates.
IMPORTANT: Changes made to a drawing in CAD mode are not automatically reflected in the New Plots view. You must update plots manually to see the changes. For details, see Updating plots.
Navigating in a New Plots view is similar to navigating in CAD mode. The arrow keys are available to help you move in the direction that is noted on the key. As well, scroll bars along the side and bottom of the window will move you horizontally and vertically along the window.
For a complete list of the navigation tools that are available, refer to Keyboard and mouse control.
The Command Line toolbar is available to help you enter coordinates when placing objects such as lines in a New Plots view. For more information on Command Line, see Command Line.
Plots are 2D schematics of your CAD model for printout. You can generate as many plots as you like. Once generated, the “view type” of the New Plot or schematic is set and cannot be changed. There are five plot types available.
Plot Type |
Description |
|---|---|
Generates the schematic from above looking down. |
|
Generates the schematic looking from the left side through the venue. |
|
Generates the schematic looking from the right side through the venue. |
|
Generates the schematic looking from the front side through the venue. |
|
Generates the schematic looking from the back side through the venue. |
Result: The type of plot that you chose is created and a shortcut to your new plot is added to the New Plots shortcut bar. For information on working with shortcuts, refer to Working with shortcuts.
Note: The plot is created with a specific set of default properties, but you can modify these settings as required. For more information on the settings, see Modifying the properties of a plot below.
Changes made to a drawing in CAD mode are not automatically reflected in the New Plots view. You must update plots manually.
Note: WYSIWYG automatically replaces inserted Truss Rigging Point symbols that were inserted from the Library Browser with drawn Rigging Point objects whenever a file is loaded or merged. However, the replacement of Truss Rigging Point symbols do not automatically update New Plots. You must remove or replace the inserted Truss Rigging Point symbols from New Plots manually and click the Update New Plot command.
Note: If the New Plots view already reflects the current CAD drawing, the option is disabled.
You can modify the border thickness, paper size, or scaling of a plot.
Tip: You can also use the View Options tool on the Standard toolbar.
The
View Options button.
Result: The View Options dialog box appears.

Options on the New Plot View Properties tab affect the appearance of the plot.
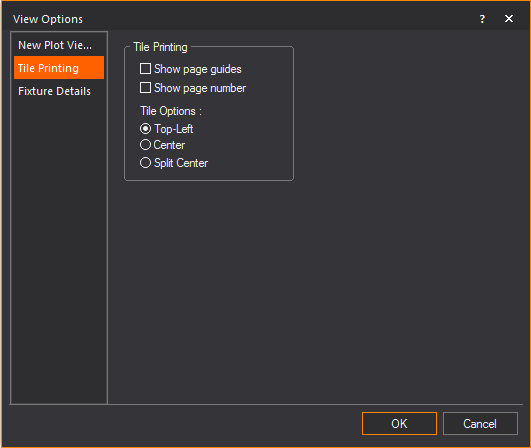
Options on the Tile Printing tab affect the printout of the plot.
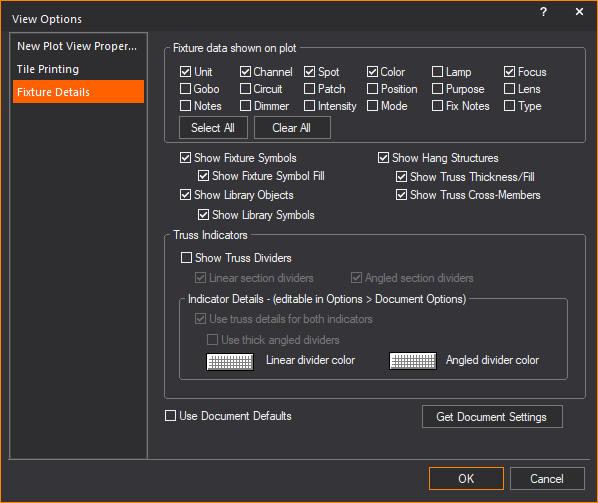
Options on the Fixture Details tab affect the fixture data that is displayed on the plot.
You can move the page around to capture the parts of the schematic that you want plotted or printed.
Result: A hand similar to the Pan tool is displayed.
Objects that are contained in the drawing in CAD mode are transposed to the New Plot representation. This representation is a 2D presentation of the drawing, and as such, certain objects are displayed differently than they are in the 3D CAD mode drawing.
A specific number of objects are used to represent the objects in the CAD drawing. These objects are listed in the following table.
Object in CAD mode |
Resulting object in New Plots |
|---|---|
Fixtures |
Representative symbols |
Accessories |
Representative symbols |
Riser |
Riser |
Text |
Text |
Arc |
Arc |
Ellipse |
Ellipse |
Circle |
Circle |
Notes:
Fixtures and hang structures are transposed to a New Plots view from CAD mode and can be manipulated independently of their counterparts in CAD. This means that in a New Plots view, they can be deleted, copied, moved, and have their properties modified without affecting the original object in CAD mode. For example, moving a pipe does not cause the same pipe to also move in CAD mode. You can easily create your lighting plot in a New Plots view independently of the drawing or “model” in CAD mode.
In contrast, changes made to the original “model” in CAD mode are reflected in all New Plots views. Objects that are deleted in CAD mode are also deleted from all New Plots views. Similarly, objects added in CAD mode are also added to all New Plots views, provided the layer they are on is visible. Note, however, that in order for new objects to appear, you must first update the New Plot by right-clicking on it and selecting Update New Plot. The same logic applies to objects that are moved in CAD mode: moving an object causes the object to also move in all New Plots views as long as the relationship between the object in CAD mode and New Plots is intact.
To achieve a relationship between fixtures and hang structures in CAD mode and fixtures and hang structures in New Plots views, various types of links are available. These links track the position and properties of the original CAD object in New Plots, and are referred to as the positional and properties links, respectively. For more information on these links and how they work, see Links.
You cannot modify data, such as fixture attributes, directly in a New Plots view; instead, you must edit this data in DATA mode. Data that is modified in the spreadsheet view in DATA mode is also updated in CAD mode and in all New Plots views.
There are three types of links in the New Plots view: positional, properties, and attributes.
The position link tracks the movement of fixtures and hang structures that are brought in from the original CAD drawing. By default, this link is in place until one of the fixtures and hang structures from the original CAD drawing is moved relative to its origin.
The properties link tracks the changes to properties for fixtures and hang structures that are brought in from the original CAD drawing. These properties include the layer line color and line weight of an object. By default, this link is in place until you modify one or more of these properties.
The attribute link tracks the changes to the attribute layout of fixtures. By default, this link is in place until you move, rotate, or otherwise manipulate the layout of a fixture attribute. For more information on attribute layout, see Attribute layout.
When a link to an object is broken, all subsequent changes that are made to that object in CAD mode will not be reflected in a New Plots view. You must reestablish the relationship or link to ensure that changes made in CAD or DATA mode are reflected in a New Plots view.
Reestablishing the link returns the object to its original state before the link was broken. For example, reestablishing the link of a fixture that has been moved off a pipe moves the fixture back to its original position on the pipe.
Result: The Links dialog box appears.
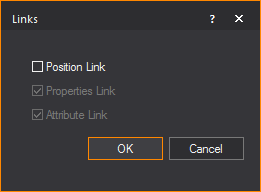
Note: The Position Link checkbox is not selected. This means that an action occurred that broke that link.
Result: The positional link is reestablished.
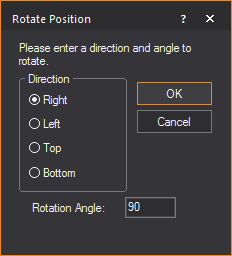
In the New Plots view, non-horizontal hang structures, such as booms and ladders can be rotated around their base to show all mounted fixtures. The rotation can be top, bottom, left, or right.
Result: The Rotate Position dialog box appears.
Result: The hang structure is rotated on the plot.
As an example, you may have three booms on your plot that you want to rotate.
After you rotate the hang structures 90 degrees to the right, the following is displayed.
You can easily modify the layout of fixture attributes in a New Plots view by simply moving, rotating, or otherwise manipulating the appearance of the attribute. In a New Plots view, you can only manipulate the layout; you cannot modify the data contained within the attribute. To modify the data, you will need to go to CAD or DATA mode and make the modifications.
Fixture attribute values that are changed in CAD or DATA mode are reflected in all New Plots views.
The attributes that are displayed in a New Plots view are determined by the options you set on the Fixture Details tab. For more information, see Fixture Details tab.
Note: This action breaks the attribute link.
As an example, you may wish to move the channel attribute (the red “2”) shown on the plot below.
After you select and drag the attribute to the desired location, the following is displayed.
You can add objects to the plot for notation. Objects that you can draw include lines, arcs, circles, and text labels. You can also insert symbols from the Library Browser.
Drawing circles in a New Plots view is similar to drawing circles in CAD mode. You can access the Circle tool from the Draw menu or from the New Plot Options toolbar. For information on drawing circles, see Drawing circles.
You can change the line pattern of a circle from its Properties window in New Plots.
Note: When you add objects such as circles to your plot, they are not added to your drawing in CAD mode.
Drawing arcs in a New Plots view is similar to drawing arcs in CAD mode. You can access the Arc tool from the Draw menu or from the New Plot Options toolbar. For more information, see Drawing arcs.
You can change the line pattern of an arc from its Properties window in New Plots.
After you have drawn an arc, you can choose to add arrows to one or both ends of the arc. The default is none. For information on adding arrows, see Object-specific properties.
Drawing lines in a New Plots view is similar to drawing lines in CAD mode. For more information, see Drawing lines.
You can use the appropriate Line tool from the Draw menu or the New Plot Options toolbar. The available line tools are as follows:
You can create a double line from a single line by modifying the properties of a line. For more information on creating double lines, see Object-specific properties.
After you have drawn a line, you can choose to add arrows to one or both ends of the line. The default is none. For information on adding arrows, see Object-specific properties.
Note: When you add objects such as lines to your plot, they are not added to your drawing in CAD mode.
Drawing text in a New Plots view is similar to drawing text in CAD mode. You can access the Text tool from the Draw menu or on the New Plot Options toolbar. For more information, see Drawing text labels.
Notes:
You can specify the font that you would like to appear globally in all new text labels that you create in New Plots.
Note: When you change the font globally, it does not affect existing labels in your file, only new ones that you draw. You cannot change the font of existing labels in New Plots view.
You can insert symbols that are not associated with any object in CAD mode. This allows you to represent the fixtures when you draw a key or want to show the position of a boom in a plan view, for example. You can access the Symbol tool from the Draw menu or from the New Plot Options toolbar.
 The Symbol button.
To learn how to insert symbols, see To insert objects from the library. In the New Plots view, the Library Browser contains only the Symbol library.
A number of tools are available in the New Plots view to help you manipulate objects.
Note: Orthographic mode is available in New Plots from the Edit menu and also from the New Plots Options toolbar. When ortho mode is active, you can manipulate objects either vertically or horizontally. For more information on this mode, see Ortho.
Objects are transposed from CAD mode and can, therefore, be selected independently of that mode (for example, moving a pipe in New Plots will not cause it to also move in CAD mode).
Fixture symbols are grouped with the hang structure to which they are mounted. Selecting and moving the hang structure will also move the mounted fixture symbols. Similarly, accessories are grouped with the fixture symbols to which they are attached and will also move with the fixture symbols. You can also select an individual fixture symbol separately from the hang structure if you want to move or modify it independently. You can also select fixtures by their Fixture Group. Fixture Groups created in CAD, DATA, DESIGN, and LIVE Modes are available in New Plots.
The methods for selecting an object are similar to those for selecting an object in CAD mode. For more information on these methods, see Selecting.
When you copy and paste an object in a New Plots view, a second representation of that same object is created. If you subsequently update the data for this object in either CAD or DATA mode (for example, gel color or channel number), all representations of that object in all New Plots views are updated.
Copied objects are not added to the drawing in CAD mode nor to the spreadsheet in DATA mode.
You can copy and paste objects between New Plots views.
When you cut an object in a New Plots view it is not removed from CAD mode. However, cutting an object in CAD mode removes it from all New Plots views.
Cutting an object adds it to the clipboard. You can subsequently paste the object into a New Plots view.
You can cut and paste objects between New Plots views.
Deleting an object in a New Plots view does not delete the original object in CAD mode. However, deleting an object in CAD mode does delete the representation of that object in all New Plots views.
Result: The object is removed from all New Plots views.
Note: If you accidentally deleted an object, you can recover it by choosing Undo Delete from the Edit menu.
The Move command in the New Plots view supports both absolute and relative moves in a manner similar to CAD mode. For more information on this command, see Moving.
When you move a hang structure, you also move all its attached fixtures and accessories. You also break the positional link between the pipe in CAD mode and the pipe in the New Plots view. All fixtures and accessories that are attached to that pipe still maintain their link to the original objects in CAD mode, even though they have also moved.
When you move a fixture off of a hang structure, you fix its location in relation to the hang structure. For example, if you move a fixture off a pipe, and then move the pipe 10 feet, the fixture also moves with the pipe. This action breaks the positional link of the fixture to the hang structure.
Note: You can “nudge” objects up, down, left, or right a certain distance by using specific key combinations. Use the ALT+arrow keys to “nudge” an object a specific distance; use the ALT+SHIFT+arrow keys to “nudge” an object a tenth of that distance.
You can use the Align tools to quickly and precisely align a series of objects that you have drawn or inserted from the Library into your drawing. For example, if you have manually placed some chairs in your drawing, you can select them all and align them in one of six ways.
Notes: You cannot use the Align tool to align fixtures.
You can align the selected objects from the:
Before choosing any of these options, you must select one of following three options:
Note: Before you align the objects, it is recommended you first verify that they will not overlap each other in their new positions.
The Rotate command in a New Plots view works in a similar manner as it does in CAD mode. For more information on this command, see Rotating objects.
Note: Rotating an object breaks its positional link.
The Fillet command in a New Plots view works in a similar manner as it does in CAD mode. For more information on this command, see Fillet.
There are general properties for each fixture or hang structure that is brought into a New Plots view from CAD mode. You can modify these general properties as required.
Options on the General tab affect the selected object’s color and line weight properties.
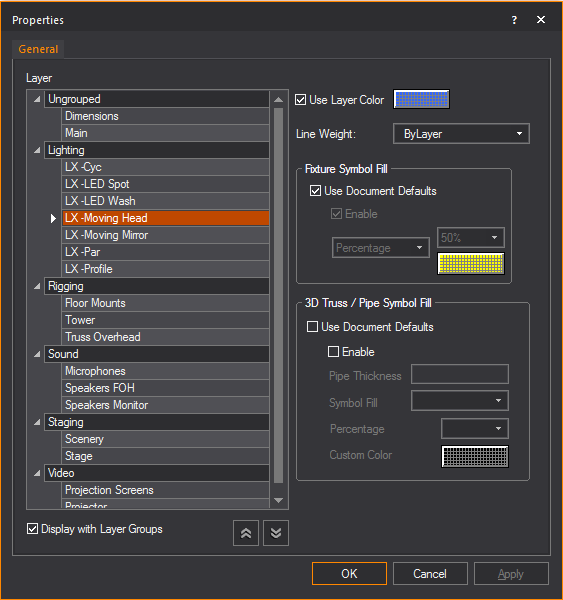
Clear the checkbox, and then use the color button to set a specific color for the object.
Options for fixture symbols to be filled with a choice of colors and fill percentage.
Options that affect how pipe and truss symbols are displayed in the plot.
Catalog name and other information of fixtures and trusses can be retrieved and displayed in New Plots.
Result: The New Text Label window appears.
Note: You can also add other text and smart variables, and specify text properties in the New Text Label window.
Objects such as lines, arcs, symbols, circles, and text that are drawn in a New Plots view have general properties that are inherited from the layer on which they are drawn. Along with the general properties, a tab appears in the properties dialog box for each type of object that is selected. When you select multiple objects of different types, tabs appear for each type of object selected.
For more information, see Drawing objects.
Options on the New Plot Object tab affect the selected object’s color and line weight properties.
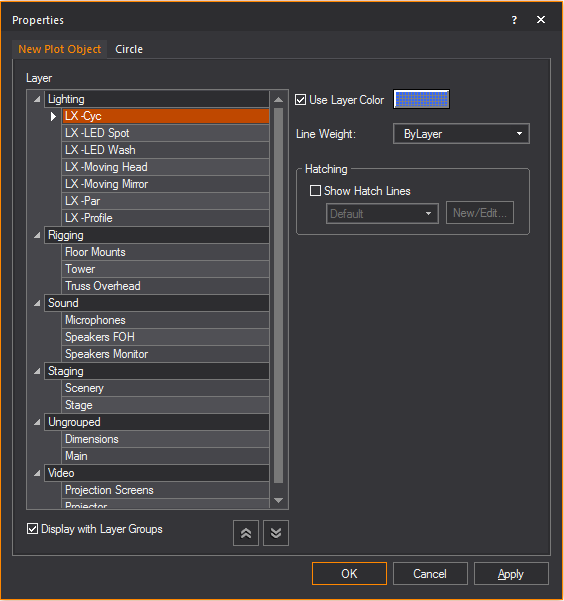
For a detailed description of the options available on this window, refer to the General tab.
Similar to objects in CAD mode, objects that are drawn in a New Plots view have properties that are specific to that object.
Text label: For a description of text label properties, refer to the Text Label tab.
Symbol: For a description of symbol properties, refer to Symbol properties.
Line: Options on the Line tab affect how the line is drawn.
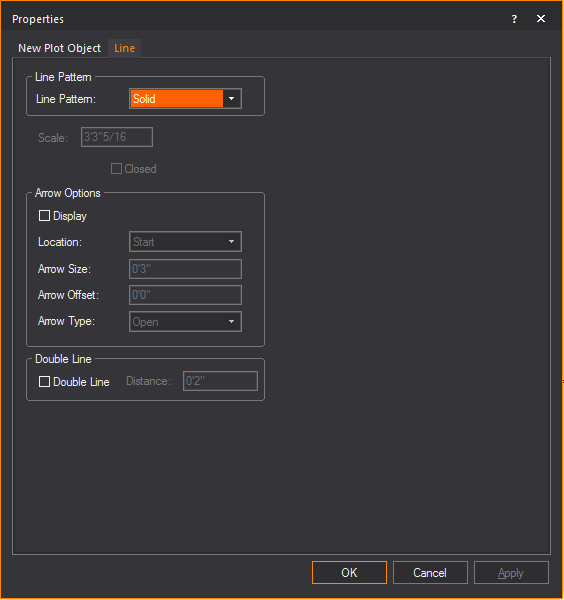
How arrows attached to the line will display.
Circle: The properties are the same as when the object was originally drawn. For more information, see Drawing circles.
Arc: The radius and angle properties are the same as when the object was originally drawn. The only property that is different is the addition of arrows to either side of the selected arc.
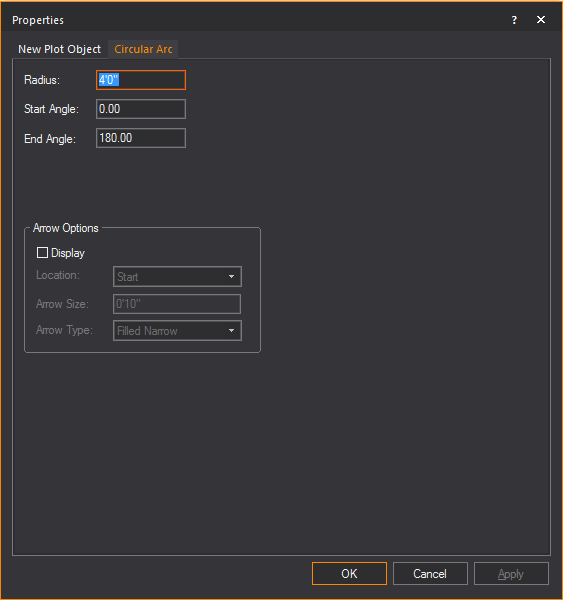
How arrows attached to the line will be shown.
Once you create your New Plot, you can insert it into the Layouts view. For example, you might want to insert it into a Layouts view so that you can add a legend, key, or report to your plot.
For more information on inserting a New Plot, see To insert new plot items onto the layout.
While you can print directly from the New Plots tab, it is strongly recommended that you first insert your completed New Plot into a Layout and print it from there. Doing so enables you to take advantage of the Layout tools (and others), use title blocks, add images, and so on.
If you have a large plot you can “tile print” the plot across multiple smaller sheets of paper. To set up how you want the plot arranged on the sheets of paper, refer to the Tile Printing tab.
You can print your complete plot or specific pages of your plot based on the settings that you choose.
Note: Objects outside the border are not printed, even if they are within the margins of the page. To adjust margins, refer to Modifying the properties of a plot.
Result: The Print dialog box appears.
From the Name drop-down list, choose the printer (or plotter) that you want to use. WYSIWYG records the name that you choose for future reference and displays it as the default printer for plots.
To print all pages of a plot, select All.
To print select pages of a plot, select Pages, and then enter the range in the from and to boxes.
To print multiple copies of pages, select the value from the Number of copies list box.
Click OK.
![]() © CAST Group of Companies Inc., 2002-2023 All rights reserved.
© CAST Group of Companies Inc., 2002-2023 All rights reserved.